Summary
Why electrification needs energy efficiency as a partner
Key questions
- How are energy efficiency and electrification developing in the industrial sector?
- Which national energy efficiency policies contribute to these trends?
- What do country case studies using the ODYSSEE and MURE databases and its tools say about the role of electrification and energy efficiency for the decarbonization of industry?
Lead authors: Barbara Schlomann, Wolfgang Eichhammer, Niklas Reinfandt (Fraunhofer ISI)
Reviewers: Janita Andrijevskaja, Inge Roos, Anna Volkova (TalTech)
Introduction
The ODYSSEE-MURE project tracks energy efficiency indicators (ODYSSEE database) and policy measures (MURE database) across or all 27 EU Member States, the EU as a whole, Switzerland and the Energy Community Contracting Parties (Albania, Bosnia-Herzegovina, Georgia, Kosovo, North Macedonia, Moldova, Montenegro, Serbia, and Ukraine). The project's first physical meeting (Chișinău, Moldova, 5-6 November 2025) focused on industry, combining an EU-level overview of ODYSSEE indicators and MURE policies with country presentations from 5 EU Member States (Bulgaria, Finland, France, Germany, the Netherlands, Poland) and two Energy Community Parties.
This policy brief synthesises that session for EU policymakers and researchers around one key finding: while electrification of industry advances only slowly, energy efficiency has been – and remains – the dominant driver of industrial decarbonisation.
Energy efficiency and electrification trends in industry
EU-27 and selected Member States
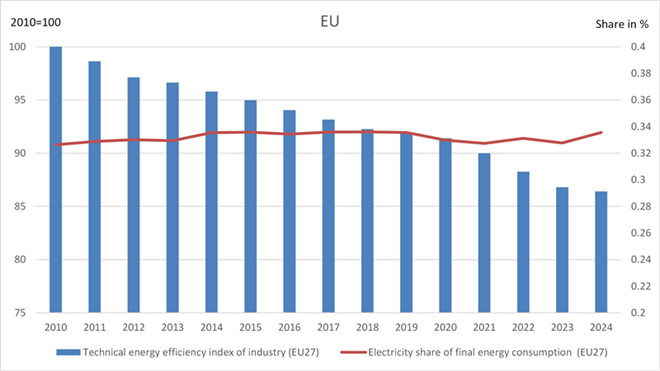
Figure 1 compares the achieved energy efficiency gains1 in EU industry with the trend of industrial electrification. It shows that energy efficiency considerably improved between 2010 and 2024, whereas the share of electricity in total industrial energy consumption remained almost stable at around 33-34%.
The improvement of energy efficiency is – besides the autonomous technical progress – strongly influenced by energy efficiency policies both at the level of the EU (as for example the Energy Efficiency Directive EED, the Ecodesign for Sustainable Products Regulation ESPR or the Commission’s Electrification Action Plan from July 2026) and at the national level. Table 1 shows exemplary policy measures with an high impact on energy savings2 in selected Member States.
Figure 1: Development of the technical energy efficiency index (ODEX) and share of electricity in final energy consumption in EU-27 industry (2010-2024)
Source: ODYSSEE database
Table 1:Energy efficiency measures with an high impact on industrial energy savings in selected EU Member States and respective improvement of the technical ODEX and electrification trend between 2010 and 2024
| Country | Measure | Type | Improvement of technical ODEX | Electricity share in energy consumption | |
| 2010-2024 (2010=100) | 2010 | 2024 | |||
| Bulgaria | Program Competitiveness and Innovation in Enterprises | Financial | 69.4 | 26% | 30% |
| Finland | Energy Efficiency Agreements for Industries |
Others - Negotiated/ Voluntary agreements |
88.7 | 32% | 31% |
| France | Reduction in Electricity Transmission Tariff for Energy-efficient Industries (TURPE) | Fiscal | 81.5 | 36% | 36% |
| Germany | Federal Support for Energy and Resource Efficiency in the Economy | Financial | 88.6 | 34% | 35% |
| Netherlands | CO2 Emission Surcharge for Industry | Fiscal | 81.1 | 23% | 23% |
| Poland | Cogeneration for Energy and Industry | Market-based – Emission trading | 68.7 | 26% | 32% |
Sources: MURE database; ODYSSEE database
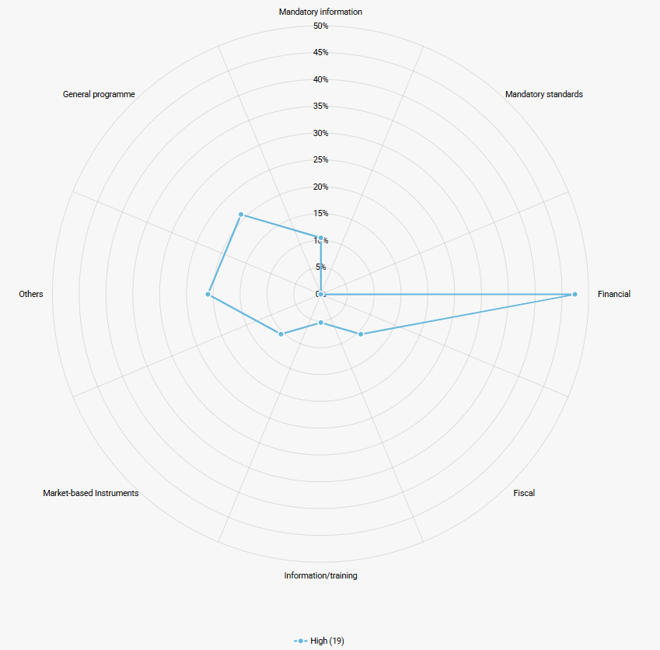
Though most of the high impact measures in these countries are financial subsidies for energy efficiency and decarbonization technologies, there is still a variety of other measure types as e.g. the voluntary agreements in Finland, market-based instruments (ETS) in Poland or a fiscal instrument in the Netherlands (see Figure 2).
Figure 2: Structure of high impact measures in the selected Member States (Bulgaria, Finland, France, Germany, Netherlands, Poland)
Source: MURE database – Radar graphs
When looking at the respective energy efficiency and electrification trends in these countries (see Table 1), a similar development as in the EU-27 as a whole can be observed between 2010 and 2024. However, the energy efficiency improvement in the two Eastern Member States – Bulgaria and Poland – is more pronounced and electrification rises to a similar level as the EU-average.
Energy Community Contracting Parties
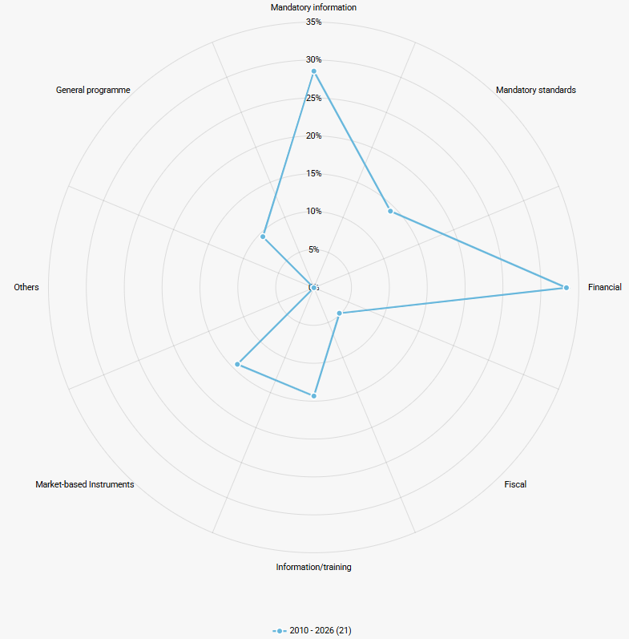
A similar analysis of two Energy Community Parties (Georgia, North Macedonia) shows a similar share of electricity in total electricity consumption of around one third (Table 2). Compared to the EU Member States, the policy mix in the Energy Community Parties is more heterogenous. In addition to financial subsidies, general programmes for energy efficiency, market-based instruments and information/training also play a role (Figure 3).
Table 2:Energy efficiency measures in industry in selected Energy Community Parties and respective improvement of the electrification trend between 2018 and 2024
| Country | Measure | Type | Improvement of technical ODEX in the period 2018-2024 | Share of electricity in final industrial energy consumption | |
| (2018=100) | 2018 | 2024 | |||
| Georgia | Reduction of losses in electricity transmission networks and grid integration of new generation | General programme | n.a. | 33% | 34% |
| North Macedonia | Introduction of efficient electric motors | Market-based instruments – Technology procurement | n.a. | 32% | 28% |
Note: Data for the Energy Community Countries in ODYSSEE are only available from 2018 onwards, therefore only data for 2018-2024 can be provided. Due to data gaps, most of the energy efficiency indicators – as e.g. the ODEX - cannot be calculated.
Sources: MURE database; ODYSSEE database
Figure 3: Policy mix addressing the industrial sector in the Energy Community Parties (Albania, Bosnia-Herzegovina, Georgia, Kosovo, North Macedonia, Moldova, Montenegro, Serbia, and Ukraine
Source: MURE database – Radar graphs
The role of electrification and energy efficiency for the decarbonisation of the industrial sector
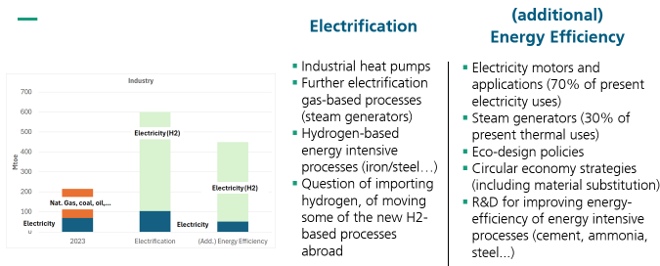
As Figure 4 shows, both electrification and additional energy efficiency are complementary measures to reduce CO2 emission in the industrial sector. They both contribute to the observed improvement of the technical ODEX. But the slow trend of electrification compared to the significant improvement of ODEX also shows that additional energy efficiency measures had a strong impact on decarbonisation during the last 15 years in Europe.
Figure 4: Contribution of electrification and additional energy efficiency measures to a reduction of CO2 emissions in EU’s industry
Source: Eichhammer, W.: Accelerating the energy transition in a world of geopolitical unrest.
Presentation at the Inter-Parliamentary Meeting on Renewable Energy and Energy Efficiency (IPM25 Copenhagen).
Country case studies
In addition to the data already analysed above for the selected countries, case studies have been conducted using further data from the ODYSSEE and MURE databases. These case studies give more insight into the policy mixes addressing energy efficiency and decarbonisation in these countries.
Bulgaria: Three targeted MURE measures – covering renewable self-consumption, green hydrogen/biogas and competitiveness funding – illustrate a compact, well-monitored policy set, contributing to the observed strong improvement of ODEX since 2010 (see Table 1).
Finland: Long-standing, high-coverage Energy Efficiency Agreements (voluntary, covering over 60% of industrial energy use, renewed for 2026-2035) underpin the ODEX improvement since 2010 (see Table 1), with the automotive sector achieving the largest gains (48% since 2000).
France: A layered mix of Energy Savings Certificates (~€5 billion/year market), EU ETS carbon pricing, mandatory energy audits and targeted decarbonisation grants (DECARB IND, up to €30 million/project) has contributed to the observed improvement of ODEX since 2010 (see Table 1).
Germany: The EEE federal funding programme (six modules, >55,000 approvals and €2.9 billion committed 2019-2023) is the central efficiency instrument for industry in Germany, projected to deliver 4.6 Mt CO2eq savings by 2030, complemented by Carbon Contracts for Difference for energy-intensive industries. The energy efficiency progress measured by ODEX was however lower than in the other selected countries except Finland (see Table 1).
Georgia: Industrial energy intensity remains still higher than in Western Europe, but improved considerably by 13% since 2013. A national Energy Efficiency Law and the NEEAP target (14% savings by 2025) are supported by UNIDO, EBRD and EU programmes, though financing access and data gaps persist.
Netherlands: The chemical sector, 58% of manufacturing final energy use, shows only slow electrification progress: grid congestion and nitrogen-emission restrictions constrain uptake despite a national carbon tax and decarbonisation subsidies.
North Macedonia: A key development is the gradual substitution of oil-based fuels with natural gas and electricity, particularly after 2022, as part of efforts to strengthen energy security and reduce import dependency. Most significant energy efficiency improvements have been observed in metallurgy, cement, and food industries.
Poland: The single largest quantified measure in the MURE scoreboard – an ETS-linked cogeneration scheme worth 151 PJ of projected 2030 savings – anchors a policy mix that also targets district heating and geothermal potential in energy-intensive branches.
Key messages
- The progress made in improving energy efficiency in industry in the EU and selected countries has been significantly higher than the electrification trend observed since 2010. These two key strategies both contribute to the EU’s climate targets for 2030 and beyond, complementing each other in the process to decarbonize the European industry.
- As the country case studies show, the indicator and policy tools provided by the ODYSSEE and MURE database are useful tools to analyze and visualize these developments. The energy efficiency index ODEX is frequently used on the indicator side, the quantitative impact of energy efficiency policies is a key figure on the measure side.
- Competitiveness and energy efficiency are not a conflict, but an opportunity: energy efficiency measures strengthen competitiveness of industry both at the level of companies and the whole economy by lowering energy costs and increasing productivity.
Notes
- 1: In ODYSSEE, energy efficiency gains are measures by a technical energy efficiency index (ODEX), which is cleaned from the development of industrial production and structural changes within industry (also see Policy brief on “Energy efficiency trends in industry” from January 2026).
- 2: In the MURE database, a high impact on energy savings is defined as ≥0.5% of the overall final energy consumption of the respective sector.
October 2026