Summary
Key questions
- How has industrial energy consumption evolved in the context of high energy prices?
- Is the industrial sector making significant progress in energy efficiency and decarbonization?
See also the proceedings of the webinar of 16 December 2025
Lead authors: Bruno Lapillonne, Fréderic Pinto Da Rocha, Zineb Raji (Enerdata)
Reviewers: Janita Andrijevskaja (TalTech University), Jean-Sébastien Broc (IEECP), Mara Oprea (IEECP)
Energy consumption trends
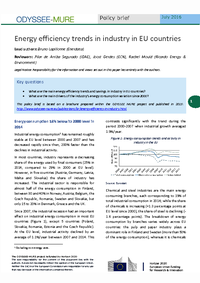
Between 2021 and 2023, EU industrial1 final energy consumption decreased sharply (-12%), primarily due to soaring energy prices. It recovered slightly in 2024, yet remains 12% below 2010 levels (Figure 1). Around 70% of this consumption in the EU is attributable to 5 branches, namely chemicals (20%), non-metallic minerals (14%), paper (14%) food (13%) and steel (including blast furnaces)2 (10%).
Among large EU countries, Poland experienced the largest decrease in consumption since 2021 (-15%). Germany is the largest contributing country to the EU consumption reduction (23%), followed by France, Italy and Spain.
Figure 1: Variation in final energy consumption, average energy prices and value added of industry in the EU

Source: ODYSSEE, based on Eurostat data ; *2024 estimated
The average energy price in industry varied significantly over the past years: it soared by 16% in 2021 and 54% in 2022, and then decreased by 10%/year from 2022 to 2024. Nevertheless, this price remained 33% higher in 2024 than in 2019, after a peak at +70% in 2022 (Figure 2). The magnitude of the 2022 price hike varied across countries, ranging from 23% to 85% compared to 2019.
Figure 2: Variation in average energy price in industry at EU level*

Source: ODYSSEE |*Weighted average price at constant prices
Between 2021 and 2023, industrial consumption fell by 12% at the EU level, with the most significant reduction observed in three branches (Figure 3): chemicals (-16%), non-metallic minerals (-17%) and steel (-13%). Together, these branches accounted for 55% of the overall reduction in industrial final energy consumption.
Figure 3: Final energy consumption by branch in the EU

Source: ODYSSEE, based on Eurostat data
Energy efficiency trends and energy savings
In ODYSSEE, energy efficiency progress is measured by branch, with indicators of specific consumption measured in physical units3, selected to be as close as possible to energy efficiency.
An energy efficiency index is then calculated for the whole industry sector. This index, referred to as “ODEX”, is calculated by converting variations in specific consumption by branch into indices, that are weighted by the share of each branch in the industry’s consumption4. ODEX is based on 15 branches. It is cleaned from structural changes between these 15 branches, however, changes in product mix within a branch can still influence the results.
Industry energy efficiency improved by 19% at EU level since 2010 (i.e. 1.5% per year). This progress was mainly driven by two branches: chemicals (42% progress) and non-metallic minerals (13% progress), while the steel, paper and food branches have shown minimal improvement (Figure 4).
Energy efficiency improvement accelerated from 2019 to 2023 (2.4%/year) compared to the 2010-2019 period (1.2%/year). Estimates for 2024 show progress comparable to 2010-2019 levels.
Figure 4: Energy Efficiency Index Industry - EU

Source: ODYSSEE
At the country level, 7 EU Member States saw an acceleration of energy efficiency improvement since 2019 and 17 countries observed a slowdown (limited for half of them). Denmark, Slovenia and Germany show a rather stable efficiency trend since 2010 (Figure 5).
Several factors may explain the acceleration of energy savings since 2020:
- Better management of energy use and emergency measures to combat the huge prices increases, particularly in 2022.
- Investment in energy saving equipment and technologies (growth driven in 2021 and price driven in 2021-22).
- In some branches, part of the “measured savings” corresponds to structural effects within industrial branches (“product effects”). This was especially significant in chemicals with a high growth for pharmaceutical products (+28% over 2021-23) and a deep recession for basic chemicals (-14%)5.
Since 2000, final energy savings reached 100 Mtoe in 2024 (of which, almost 60 Mtoe since 2010) (Figure 6). Consequently, without energy efficiency progress, EU industry final energy consumption would have been 100 Mtoe higher than its current level (i.e. 30% higher).
Figure 5: Energy efficiency progress in industry in EU Member States

Source: ODYSSEE, based on Eurostat data
Figure 6: Cumulated annual final energy savings in industry in the EU (Mtoe)

Source: ODYSSEE
Factors of variation of energy consumption
In 2024, EU industrial final energy consumption was 32 Mtoe below its 2010 level, resulting from large energy savings (-53 Mtoe) and structural effects caused by a higher growth of less energy-intensive branches (-18 Mtoe). These effects greatly offset the increase in industrial activity (+25 Mtoe) (Figure 7).
Figure 7: Decomposition of industry consumption variation in the EU (2010 - 2024) (Mtoe)

Source: ODYSSEE
The rapid decrease in the industrial final energy consumption between 2019 and 2023 (-29 Mtoe) is explained by energy savings6 (-24 Mtoe) and structural effects (-12 Mtoe). These more than offset the industrial growth effect (+7 Mtoe) (Figure 8).
Figure 8: Decomposition of industry consumption variation in the EU (2019 - 2023) (Mtoe)

Source: ODYSSEE
Electrification trends
Industrial electrification at the EU level has been notably slow since 2010. The share of electricity in energy consumption has increased by just 0.5 points since 2010, reaching 33% in 2024.
The electrification rate varies significantly across countries, ranging for the largest EU countries from 24% in the Netherlands to 40% in Italy. Notably, electricity's share has decreased in half of EU countries: in 6 countries since 2010 (e.g. 8 points in Sweden), and in 8 other countries since 2019 (reversing the upward trend observed over the 2010-2019 period, as seen in Poland and Italy) (Figure 9).
Figure 9: Electrification trends in industry (%) in the EU and EU Member States

Source: ODYSSEE based on Eurostat data
In 2019, the EU’s industrial electricity consumption was equal to its 2010 level. This is explained by an increase in industrial activity (+129 TWh) and electrification (+32 TWh), exactly offset by energy savings (-119 TWh) and, to a lesser extent, structural changes (- 41 TWh). The latter is mainly driven by the growth of machinery and transport equipment branches (Figure 10).
Figure 10: Decomposition of electricity demand variation in the EU (TWh)

Source: Enerdata calculation
Between 2019 and 2023, electricity consumption decreased by 115 TWh (-12%), driven by energy savings (-105 TWh) and structural changes (-31 TWh). The electrification effect was negative (-10 TWh), due to a decrease in the electrification rate. This decrease is the result of very high electricity prices, coupled with a higher recession in electricity intensive branches.
Drivers of CO2 emissions variation in industry
CO2 emissions of EU industry decreased by 105 MtCO2 between 2010 and 2023 (-23%) due to three main factors: energy savings (-72 MtCO2), decarbonization of the energy mix - which reflects the reduction in the average emission factor - (-45 MtCO2), and structural effects (-36 MtCO2). These factors more than offset the impact of industrial activity growth (+49 MtCO2).
Decarbonisation comes from substitution between fossil fuels (e.g. switch to gas) and substitution from fossil fuels to “CO2-free fuels”7.
In the case of the EU average, two thirds of the decarbonisation at the sector level over 2010-2023 was linked to substitution to CO2-free fuels, and one third to substitution within fossil fuels. These so-called “CO₂-free fuels” are not entirely emissions-free, if there is a switch to electricity or heat, as they emit CO₂ at the level of power and heat plants. The magnitude of these indirect emissions8 depends on the power or heat mix, and varies significantly across countries.
At the EU level, changes in indirect emissions were marginal, as most of the shift to CO₂-free fuels involved biomass, while electrification remained marginal and the share of heat declined by 1 point.
Figure 11: Variation in CO2 emissions from industry - European Union (2010-2023)

Source: ODYSSEE, based on Eurostat and EEA data
Key findings
- Without energy efficiency progress achieved since 2010, EU industry final energy consumption would have been 30% higher than its current level in 2023.
- Energy efficiency improvement accelerated from 2019 to 2023 (2.4%/year) compared to the 2010-2019 period (1.2%/year). Estimates for 2024 show progress comparable to 2010-2019 levels.
- Industrial electrification at the EU level has been notably slow since 2010, even with a decrease in electricity share in half of the countries.
- CO2 emissions of EU industry decreased by 23% between 2010 and 2023, with energy savings being the first source of reductions in emissions, before decarbonisation.
- These overall results at the EU level should be interpreted with caution. Significant differences are observed among countries, and among industrial branches. Moreover, energy savings assessed with ODYSSEE indicators may include changes in energy consumption due to structural effects within a branch (e.g. changes in the share of pharmaceutical products and basic chemicals within the ‘chemicals’ branch).
Notes
- 1: Industry includes manufacturing, mining and construction.
- 2: To align with Eurostat changes, blast furnaces have been removed in 2026. This explains the differences with data currently available in ODYSSEE tools.
- 3: In toe/ton for energy intensive products (steel, cement, pulp and paper) and in toe/IPI for other branches (IPI: Index of Industrial Production).
- 4: Energy efficiency index ODEX | ODYSSEE-MURE
- 5: Enerdata’s estimates, at a higher level of detail for a limited number of countries, show that around 20% of the savings at EU level since 2019 correspond to “product effects”. These estimates are based on data published by Eurostat recently.
- 6: As explained above some products effects may still be embedded in these savings.
- 7: “Free” at industry level according to CO2 inventory (electricity, biomass or heat).
- 8: Scope 2 emissions, in the IPCC terminology.
January 2026


