Summary
Key questions
- How is my country performing with respect to energy efficiency in the 2024 Energy Efficiency Scoreboard?
- How does the 2024 edition of the European Energy Efficiency Scoreboard compare to the 2023 edition?
Lead authors: Wolfgang Eichhammer (Fraunhofer ISI)
Reviewer: Theodoros Zachariadis (The Cyprus Institute)
The European Energy Efficiency Scoreboard assesses the energy efficiency performance of EU Member States across sectors, based on the ODYSSEE-MURE databases. The scores are based on three main criteria for each country: energy efficiency level reached, energy efficiency progress and the impacts of energy efficiency policies. This policy brief presents the 2024 edition of the Scoreboard, which includes the latest energy efficiency data and policy impacts, with an emphasis on a comparison between the 2024 and 2023 edition of the Scoreboard.
Introduction
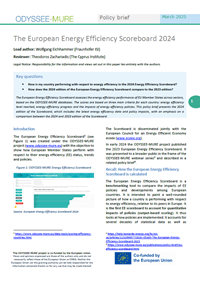
The European Energy Efficiency Scoreboard1 (see Figure 1) was created under the ODYSSEE-MURE project (www.odyssee-mure.eu) with the objective to show how European Member States perform with respect to their energy efficiency (EE) status, trends and policies.
Figure 1: ODYSSEE-MURE Energy Efficiency Scoreboard

Source: European Energy Efficiency Scoreboard 2024
The Scoreboard is disseminated jointly with the European Council for an Energy Efficient Economy eceee (www.eceee.org).
In early 2024 the ODYSSEE-MURE project published the 2023 European Energy Efficiency Scoreboard. It was presented to a broader public in the frame of the ODYSSEE-MURE webinar series2 and described in a related policy brief3.
Recall: How the European Energy Efficiency Scoreboard is calculated
The European Energy Efficiency Scoreboard is a benchmarking tool to compare the impacts of EE policies and developments among European countries. It is intended to paint a well-rounded picture of how a country is performing with respect to energy efficiency, relative to its peers in Europe. It is the first EE scoreboard to account for quantitative impacts of policies (output-based scoring). It thus looks at how policies are implemented. It accounts for several decades of statistical data as well as assessments of future impacts of adopted and planned EE programmes.
The scores are based on data from the ODYSSEE database on energy efficiency indicators (https://www.indicators.odyssee-mure.eu/) and the MURE database on energy efficiency policies (https://www.measures.odyssee-mure.eu/).
This scoreboard aids in pinpointing areas where energy efficiency policies have been successful/less successful and where efforts should be intensified.
Figure 2: The ODYSSEE-MURE Scoring Methodology

Source: European Energy Efficiency Scoreboard 2024
The scores are determined by three criteria (Figure 1):
- LEVEL: A detailed quantitative measure of a country's current performance across major sectors and end-uses. The Level Score answers the question “How is my country currently performing with respect to EE?”
- TREND: A dynamic parameter considering past development and past actions. The “Trend” score answers the question “How much progress has my country achieved in the area of EE?”
- POLICY: Relies on ex-ante assessment (i.e. it is effectively a forecast) of energy-saving expected for 2030, stemming from recent policies from a given starting year onwards (2010), converting them into a quantitative score. The Policy Score answers the question “What future impacts can I expect from recent policies enacted in my country?”
All three criteria are equally weighted. Policy scores reflect expected savings by 2030, hence are commitments for the future. Achieved policy impacts are incorporated into present levels and trends from 2010 to 2021.
The scoring for levels and trends is based on indicators adjusted to national circumstances, mainly physical indicators for energy efficiency.
Policy scores are based on impacts gathered in the MURE Database by National Teams participating in the project from each Member State. Such impacts are assessed through quantitative and semi-quantitative impact evaluations of EE measures, either from assessments of the project teams, or from the reporting obligations under the National Energy and Climate Plans (NECPs) and under Article 8 of the EED on energy saving obligations.
For each sector, the scores are then normalised to the best country by criterion and combined finally in an overall score.
Analysis of changes between the European EE Scoreboard (SB) 2024 compared to 2023
Table 1 shows the comparison between the European EE Scoreboard (SB) 2024 compared to 2023.
Table 1: Comparison of the overall ranking in the European Energy Efficiency Scoreboards 2024 and 2023

Source: European Energy Efficiency Scoreboard 2024 and 2023
The comparison is made with a colour scheme:
- Green colour: the country has gained more than two places in the 2024 edition compared to the 2023 edition.
- Light green colour: the change in the country’s position is at maximum 2 steps upwards in the Scoreboard between 2023 and 2024.
- Yellow colour: the country’s position is unchanged between 2023 and 2024.
- Light brown colour: the change in the country’s position is at maximum 2 steps downwards in the Scoreboard between 2023 and 2024.
- Red colour: the country has lost more than two positions in the scoreboard in 2024 compared to 2023.
A larger number of countries have kept their position (6 countries) or changed it moderately up- (3 countries) or downwards (7 countries). This shows that the scoreboard methodology is reaching maturity.
4 countries have substantially improved their position in the scoreboard, while 6 countries lost a substantial amount of steps in the scoring.
A deeper view to individual components (levels, trends, policies) and sectors in the scoreboard
The following tables show the three individual components (levels, trends, policies) as well as two exemplary sectors in the scoreboard (residential sector and industry):
- EE Levels: In the case of Greece and Netherlands the loss in position of the overall scoreboard is related to the level observed (see Table 2).
- EE Trends: In Greece, Hungary, Netherlands and Slovenia the loss in position of the overall scoreboard is related to the trend development. Trends have contributed positively to the position of France and compensated partly its losses in position in the overall scoreboard (see Table 3).
- EE Policies: Lack in the impacts of EE policies have negatively contributed to the position of France in the overall scoreboard (see Table 4).
- Sectoral scoreboards: Sweden and France have notably lost positions in the residential scoreboard (see Table 5) while EE in the industry scoreboard (Table 6) affected countries such as Romania, Finland and the Netherlands in the overall scoreboard.
Table 2: Comparison of the level ranking in the European Energy Efficiency Scoreboards 2024 and 2023

Source: European Energy Efficiency Scoreboard 2024 and 2023
Table 3: Comparison of the trends ranking in the European Energy Efficiency Scoreboards 2024 and 2023

Source: European Energy Efficiency Scoreboard 2024 and 2023
Table 4: Comparison of the policy ranking in the European Energy Efficiency Scoreboards 2024 and 2023

Source: European Energy Efficiency Scoreboard 2024 and 2023
Table 5: Comparison of the residential sector ranking in the European Energy Efficiency Scoreboards 2024 and 2023

Source: European Energy Efficiency Scoreboard 2024 and 2023
Table 6: Comparison of the industry sector ranking in the European Energy Efficiency Scoreboards 2024 and 2023

Source: European Energy Efficiency Scoreboard 2024 and 2023
Key messages
The comparison between 2024 and 2023 allows for several important conclusions:
- There is a comparatively stable development from the 2023 to the 2024 Scoreboard, showing the methodology reaches maturity.
- Most changes are small within a year, indica-ting a steady evolution in country positions.
- From a methodological perspective, scoring still remains a learning process and also requires strong quality control on the individual components in the scoreboard.
Notes
- 1: https://www.odyssee-mure.eu/data-tools/scoring-efficiency-countries.html
- 2: https://help.leonardo-energy.org/hc/en-us/articles/12329995772828--EEA05-The-European-Energy-Efficiency-Scoreboard-2023
- 3: https://www.odyssee-mure.eu/publications/policy-brief/eu-efficiency-scoreboard.html
For further reading or information, please visit https://www.odyssee-mure.eu/, in particular the website of the European Energy Efficiency Scoreboard 2024 on https://www.odyssee-mure.eu/data-tools/scoring-efficiency-countries.html.
More information on the scoring methodology can be found at https://www.odyssee-mure.eu/php/scoreboard-combined/documents/european-energy-efficiency-scoreboard-methodology.pdf
The webinar underlying this policy brief is available https://www.youtube.com/watch?v=QTfO-e2PbW4.
March 2025


