Summary
Key questions
- How is my country currently performing with respect to energy efficiency?
- How much progress has my country achieved in the area of energy efficiency?
- What future impacts can I expect from recent policies enacted in my country?
Lead authors: Wolfgang Eichhammer (Fraunhofer ISI) and Nils Borg (eceee)
Reviewers: Didier Bosseboeuf (ADEME)
The European Energy Efficiency Scoreboard assesses the energy efficiency performance of EU Member States across sectors, based on the ODYSSEE-MURE databases. The scores are based on three main criteria for each country: energy efficiency level reached, energy efficiency progress, and the impacts of energy efficiency policies. This policy brief presents the 2023 edition of the Scoreboard, which includes the latest energy efficiency data and policy impacts.
Introduction
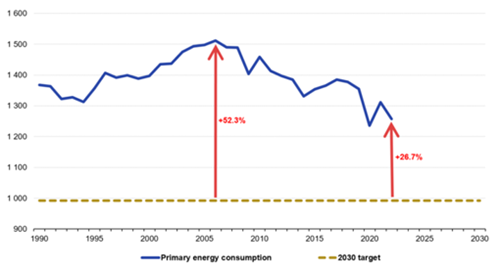
The revised Energy Efficiency Directive EED (EU/2023/1791), published in the Official Journal on 20 September 2023, significantly raises the EU’s ambition on energy efficiency. It establishes ‘energy efficiency first’ as a fundamental principle of EU energy policy, giving it a legal basis for the first time. The Directive makes it binding for EU countries to collectively ensure an additional 11.7% reduction in energy demand by 2030, compared to the 2020 reference scenario projections. Thus, EU energy consumption by 2030 should not exceed 992.5 million tonnes of oil equivalent (Mtoe) for primary energy and 763 Mtoe for final energy. The revised Directive more than doubles the annual energy savings obligation (Article 8): EU countries are required to achieve cumulative end-use energy savings for the entire obligation period (running from 2021 to 2030), equivalent to new annual savings of at least 0.8% of final energy consumption in 2021-2023, at least 1.3% in 2024-2025, 1.5 % in 2026-2027, and 1.9 % in 2028-2030. While raising ambition, the revised EED also significantly increased distance to target for the EU (Figure 1), requiring a detailed scoring of the Member States' efforts to improve energy efficiency.
Figure 1: Distance to the 2030 target for primary energy consumption in the EU27
Source: Eurostat (online data code: nrg_ind_eff)
The European Energy Efficiency Scoreboard was created under the ODYSSEE-MURE project (www.odyssee-mure.eu) with the objective to show European Member States where they stand in detail, compared to this raised ambition. It was disseminated jointly with the European Council for an Energy Efficient Economy eceee (www.eceee.org).
Methodology of the European Energy Efficiency Scoreboard 2023
The European Energy Efficiency Scoreboard 2023 is a benchmarking tool to compare the impacts of energy efficiency policies and developments among European countries. It is intended to paint a well-rounded picture of how a country is performing with respect to energy efficiency, relative to its peers in Europe. It is the first energy efficiency scoreboard to account for quantitative impacts of policies (output-based scoring). It thus looks at how policies are implemented. It accounts for several decades of statistical data, as well as future impacts of energy efficiency programmes.
The Scores are based on data from the ODYSSEE database on energy efficiency indicators1 and the MURE database on energy efficiency policies2.
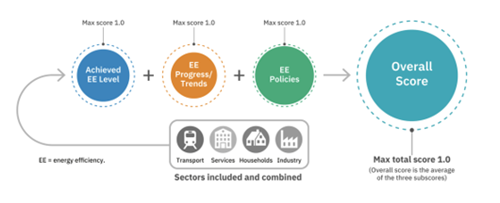
This scoreboard aids in pinpointing areas where energy efficiency policies have been successful/less successful and where efforts should be intensified. The scores are determined by three criteria (Figure 2):
- LEVEL: A detailed quantitative measure of a country's current performance across major sectors and end-uses. The Level Score answers the question “How is my country currently performing with respect to energy efficiency?”
- TREND: A dynamic parameter considering past development and past actions. The “Trend” score answers the question “How much progress has my country achieved in the area of energy efficiency?”
- POLICY: Relies on ex-ante assessment (i.e. effectively a forecast) of energy-saving expected for 2030, stemming from recent policies from a given starting year onwards (2010), converting them into a quantitative score. The Policy Score answers the question “What future impacts can I expect from recent policies enacted in my country?”
All three criteria are equally weighted. Policy scores reflect expected savings by 2030 and, hence, are commitments for the future. Achieved policy impacts are incorporated into present levels and trends from 2010 to 2021.
Figure 2: The ODYSSEE-MURE Scoring Methodology
Source: European Energy Efficiency Scoreboard 2023
The scoring for levels and trends is based on indicators adjusted to national circumstances, mainly physical indicators for energy efficiency (and not simple energy intensities), such as:
- energy use per m2 and building type (household, office...)
- energy use for passenger transport on the road (per km or per person-km)
- specific energy consumption for industrial branches
Policy scores based on impacts are gathered in the MURE Database by National Teams in each Member State from quantitative and semi-quantitative measure impact evaluations, either from national evaluations, or from the reporting obligations under the National Energy and Climate Plans (NECPs) and under Article 8 of the EED on energy saving obligations.
For each sector, the scores are then normalised to the best country for the criteria and combined finally in an overall score.
Overall scoring results from the European Energy Efficiency Scoreboard 2023
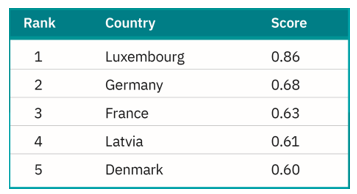
Table 1 shows the ranking of the top 5 countries in the European Energy Efficiency Scoreboard 2023 across all three components of the scoreboard (levels, trends, and policies), as well as across all sectors (households, industry, transport, and services). Luxembourg is on the first rank of the 2023 scoreboard edition, followed by Germany and France.
Table 1: Overall ranking of the top 5 countries in the European Energy Efficiency Scoreboard 2023
Source: European Energy Efficiency Scoreboard 2023
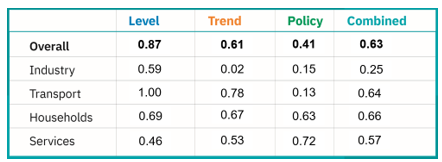
No country, even the best, is excellent in all sectors and all three components (Table 2). There is still a lot of scope to improve energy efficiency.
Table 2: Details of the energy efficiency score by component and sector for France
Source: European Energy Efficiency Scoreboard 2023
Some countries draw strongly on the policy scores. Policies scores are a promise to the future; they represent expected savings by 2030 (including, nevertheless, policies since 2010). Achieved policy impacts are included in the present levels (2021) and the trends (from 2010 to 2021).
Trends (since 2010) are more advantageous for “European Eastern and Southern” Member States, given less favourable starting positions (levels) but ambitious energy efficiency policies over the past.
A deeper view to the Residential Sector
The scoring of levels and trends in the residential sector is based on the four indicator components shown in Table 3. This comprises, notably, an indicator for space heating (which is the largest energy use in most countries of the EU27) but also indicators for other thermal uses such as cooking or sanitary hot water, for electric appliances, and the penetration of solar. These indicators are combined by weighting the individual indicator with its respective shares in energy demand.
Table 3: Indicators used to calculate the scores for energy efficiency levels and trends in the household sector

Source: European Energy Efficiency Scoreboard 2023
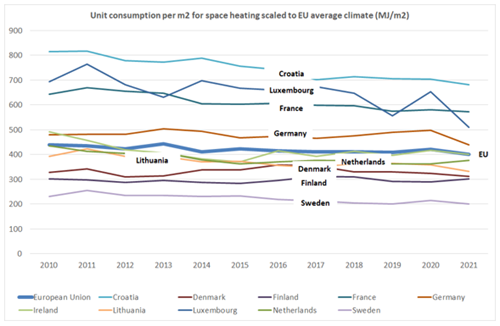
Figure 3 shows as an example the energy consumption for heating per m2. In order to have meaningful comparisons, this indicator has to be normalised for the different European climates.
Figure 3: Unit energy consumption (per square metre) for space heating scaled to EU average climate (Megajoule per square meter)
Source: European Energy Efficiency Scoreboard 2023
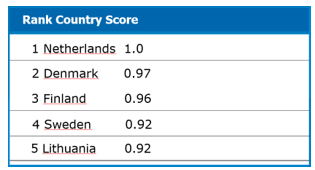
In this partial component, notably Nordic countries such as Sweden, Finland, Denmark, Lithuania, and the Netherlands appear as most performant (forced by their considerably colder climates and thanks to previous strong energy efficiency policies for space heating). Given the importance of the space heating indicator component for households, those countries then also appear on top of the level score (Table 4).
Southern countries, though using a smaller absolute amount of energy for space heating, tend to be comparatively more wasteful with energy, as less attention is paid, including behavioural aspects.
Table 4: Ranking of the top 5 countries on energy efficiency levels in the household sector
Source: European Energy Efficiency Scoreboard 2023
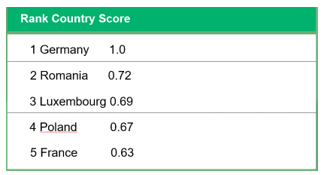
For the policy score, other countries achieve high scores given the (expected) amount of savings projected to 2030 (Table 5).
Table 5: Ranking of the top 5 countries on energy efficiency policies in the household sector
Source: European Energy Efficiency Scoreboard 2023
Examples of household energy efficiency policies for the top 5 countries in policy score include:
- Germany: Tax incentives for energy efficient building refurbishment (expected impact in 2030: 52 PJ savings). The tax incentive is limited to individual measures in owner-occupied apartments and residential buildings. The subsidy is provided in the form of a deduction from tax liability over a period of three years; 20% of the investment costs are deductible. The maximum subsidy amount is EUR 40,000. Start 2020.
- Poland: Thermo-modernization tax relief (expected impact in 2030: 24 PJ). Further: Agreements with municipalities. The municipalities issue a call for applications in their area among the residents - the final beneficiaries. These are individuals, owners of flats in multi-family houses, tenants of flats owned by the municipality, and housing communities with 3-7 flats (expected impact in 2030: 18 PJ).
- France: Mandatory standards for buildings (expected impact 2030 in households: 127 PJ): Further: Subsidy for thermal renovation of private dwellings (MaPrimeRénov') (expected impact in 2030 in households: 9 PJ) and, above all, Energy Efficiency Obligations (EEOs).
As said earlier: policy impacts projected to 2030 are promises for the future and have to be closely monitored and revised, in case their contribution appears as less important than originally projected.
Key messages
The European Energy Efficiency Scoreboard provides a monitoring tool following energy efficiency levels, trends, and policies for the four main energy-consuming sectors households, industry, transport, and services. It combines evidence-based research (based on a large number of statistical indicators) with output-based quantified policy impacts. The scores can be used to follow in detail the progress of EU Member States to the 2030 energy efficiency targets. Transparency in methodology and data is key, and stakeholder involvement in the validation is important. Limitations in the methodology arise from the statistical resolution of the indicators, from imperfect corrections for certain factors (e.g. difference in climate or industrial structure), as well as from gaps in policy evaluations and their quality.
Notes
For further reading or information, please visit https://www.odyssee-mure.eu/, in particular the website of the European Energy Efficiency Scoreboard 2023 on https://www.odyssee-mure.eu/data-tools/scoring-efficiency-countries.html.
More information on the scoring methodology can be found at https://www.odyssee-mure.eu/php/scoreboard-combined/documents/european-energy-efficiency-scoreboard-methodology.pdf
The webinar underlying this policy brief is available at https://www.youtube.com/watch?v=TZypdt9wzM8.
