Summary
Key questions
- Does energy consumption dependence on urban living show up in the Odyssee database?
- Can differences between countries be used as a measure for energy consumption reduction potential?
Lead authors: Joost Gerdes (TNO)
Reviewers: Dariusz Twaróg (Statistics Poland)
Urban living is associated with lower energy consumption due to higher expected use of public transport and more apartments, which use relatively little energy. Consumption variations between countries might indicate savings potential.
Introduction
Apart from energy efficiency, there is more and more attention for lifestyle change and energy sufficiency as a means to reduce energy consumption. There is reason to expect that urban living is related to less energy consumption than average, as people in urban areas live much more often in apartments, which require less energy for space heating, and have better access to public transport and bike infrastructure. In this paper, we will investigate if energy reduction potentials of urban living can be determined by comparing countries using Odyssee data. We will look for a relation between urban living and energy consumption by comparing energy consumption data on space heating in dwellings and passenger traffic for different countries to the share of apartments in the stock of dwellings.
Method
The share of apartments, which we will use as a measure for urbanization level, can be derived from data in the Odyssee database for most countries. We will use data for the year 2019 as this is the last ‘normal’ year before the Covid crisis, which led to much less passenger travel, and before the high energy prices in 2022 and 2023 which led to behavioural change in space heating. Another advantage is that for 2019, data on dwelling type are available for more countries.
When looking at dwellings, we will compare temperature corrected energy consumption for space heating that has also been corrected for climate to the share of apartments between countries. We do not correct for floor area as this would remove the effect of the share of apartments.
For the analysis of passenger transport, we will mainly compare energy consumption and shares of modes of transport to the share of apartments.
We will use the value of R2 as a measure for the extent to which trendlines predict the dependence on independent variables. R2 can vary from 0 to 1, where 1 indicates a perfect correlation.
Results for space heating
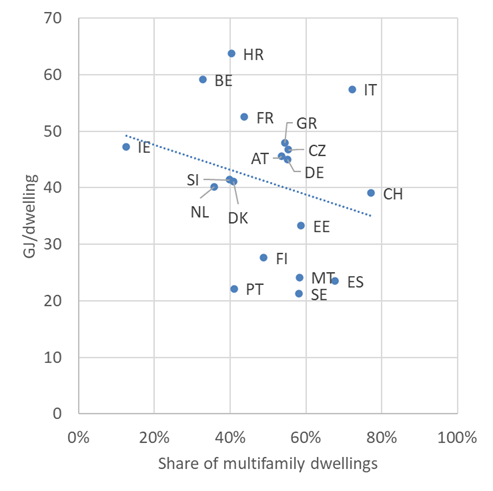
We start by looking at the energy consumption for space heating in dwellings in relation to the share of apartments. This cannot be done for all countries, as just 18 of the EU member states and Switzerland have provided data on dwelling types for the year 2019. The results are shown in Figure 1.
Figure 1: Energy consumption for space heating, corrected for temperature and climate, related to the share of apartments, both for 2019
Source: calculated using Odyssee data
Figure 1 shows a wide variety of energy consumption for space heating around the linear trendline. The R2 value is only 0.067.
One might suspect the differences could be caused in part by differences in energetic quality of the dwellings. This has been checked for the nine countries for which Odyssee has data on energy performance labels, see Table 1. Correcting the energy used for space heating using these data does not lead to a better fit of the trendline though. This can be explained in part by the fact that the estimated label effect is never larger than 17% (for Denmark) and mostly less than 10%; not enough by far to let the distance to the trendline shrink enough for a better fit.
Table 1: Estimated energy consumption for space heating in dwellings compared to G label dwellings based on EPC label shares per country and label effects in The Netherlands
| Label | Cons. comp. to G for NL (%) | Label shares | ||||||||
| CZ % | DK % | FI % | FR % | DE % | GR % | IE % | NL % | PT % | ||
| A | 61 | 2 | 20 | 0 | 2 | 2 | 0 | 3 | 13 | 2 |
| B | 74 | 4 | 10 | 1 | 2 | 7 | 0 | 6 | 9 | 7 |
| C | 83 | 16 | 24 | 1 | 5 | 16 | 2 | 11 | 8 | |
| D | 91 | 16 | 24 | 1 | 5 | 16 | 2 | 11 | 8 | |
| E | 96 | 13 | 10 | 0 | 4 | 12 | 2 | 6 | 5 | |
| F | 99 | 11 | 5 | 0 | 1 | 13 | 2 | 2 | 3 | |
| G | 100 | 23 | 2 | 0 | 0 | 12 | 3 | 3 | 2 | |
| No label (E) | 96 | 16 | 7 | 97 | 80 | 21 | 90 | 58 | 51 | 90 |
| Est. cons. comp. to G | 93 | 83 | 96 | 95 | 92 | 96 | 92 | 88 | 94 | |
Source: calculated using adjusted Odyssee data on EPC labels and the relation between energy label and energy consumption for space heating in The Netherlands from Statistic Netherlands CBS
It can also be understood in another way: not many dwellings in France (4% for A and B combined) have an efficient label for example, and energy consumption there is higher than expected based on the trendline. Dwellings in Finland on the other hand also do not have many efficient labels either (1% for A and B combined), but the energy consumption there lies far below the trendline.
This seems to indicate that many other factors play a role in the differences between energy consumption for space heating in different countries than climate and energetic quality of dwellings alone. An indication for the former is that southern European countries have both energy consumption for space heating above (Italy and Greece) and below (Portugal, Spain and Malta) the trendline. The northern European countries Sweden, Finland and Estonia all lie below the trendline.
Results for mobility
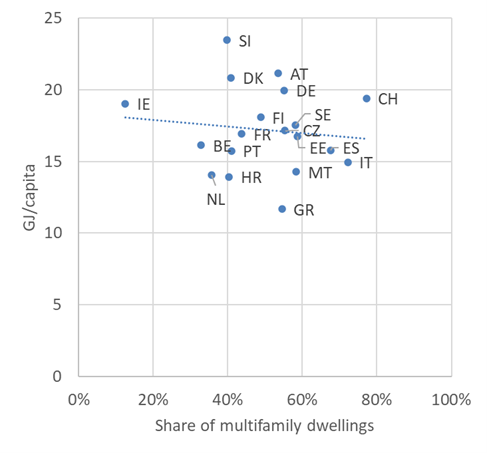
Analog to dwellings, we start by looking at the energy used for mobility in relation the share of apartments. The results are shown in Figure 2.
Figure 2: Energy consumption for mobility per person per year related to the share of apartments, both for 2019
Source: calculated using Odyssee data
There is a downward trend with an increasing share of apartments, but the R2 value for the trendline is very low: 0.014, so the share of multifamily dwellings explains only a very small fraction of the variation of consumption for passenger transport. This might be unexpected, as it would seem logical that people in more urban areas travel shorter distances to and from work, school and stores. For this reason, the person kilometres and share of multifamily dwellings have been compared.
In this case, there is no relation at all between the share of multifamily dwellings and kilometres travelled.
Next, we look at shares for different transport modes depending on share of multifamily dwellings.
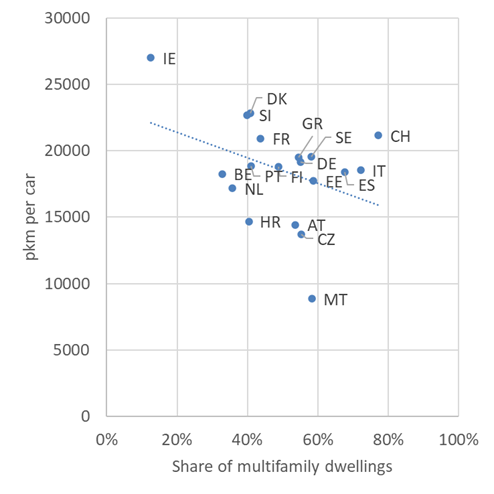
First cars. There is a weak downward trend of person kilometre travelled by car when the share of apartments increases. Maybe surprisingly, car ownership is higher in countries with a larger share of apartments. The number of kilometres per car however is lower when the share of apartments increases. This relation is stronger than others we have seen so far, with R2 equal to 0.14; see Figure 3.
Figure 3: Person kilometres travelled per car related to the share of apartments, both for 2019
Source: calculated using Odyssee data
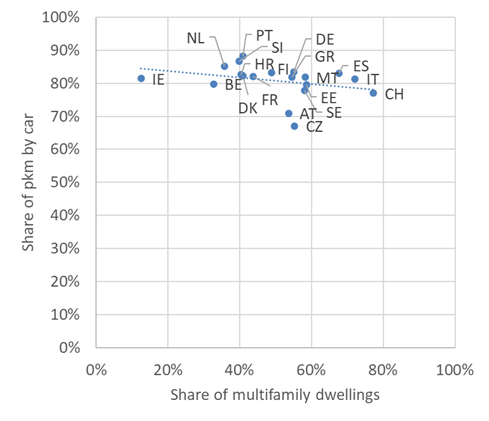
The share of person kilometres travelled by car also decreases with an increasing share of apartments, see Figure 4. R2 here is 0.09.
Figure 4: Share of person kilometres travelled by car related to the share of apartments, both for 2019
Source: calculated using Odyssee data
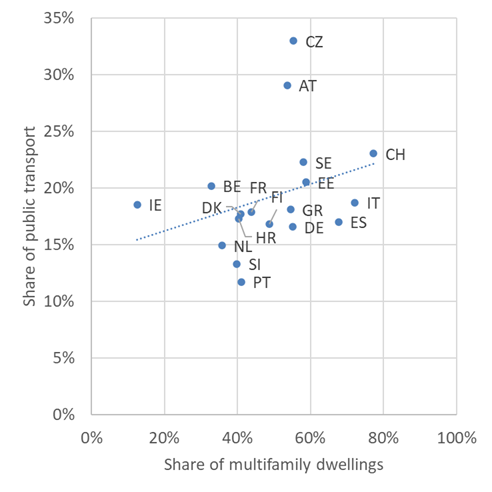
Figure 5 shows the share of public transport in all passenger traffic in relation to the share of multifamily dwellings. A relation seems visible, but R2 is still not large with a value just below 0.1.
Figure 5: Share of person kilometres travelled by public transport related to the share of apartments, both for 2019
Source: calculated using Odyssee data
An expected relationship appears between, on the one hand, a decrease in person kilometres travelled by car and the share of person kilometres travelled by car for higher shares of apartments, and on the other hand, a increasing share of person kilometres travelled by public transport for higher shares of apartments.
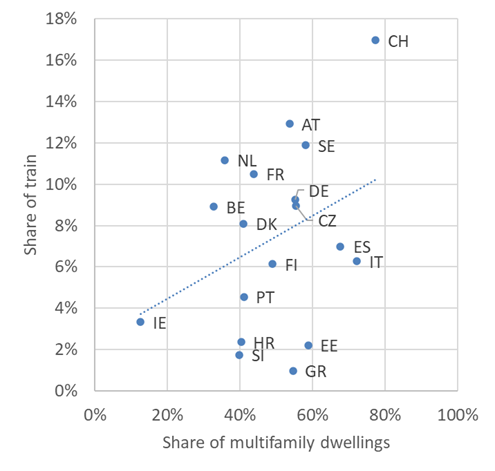
The relation between the share of rail in all passenger transport in Figure 6 shows a somewhat stronger relation than for person kilometres for all public transport in Figure 5, with R2 equal to 0.125.
Figure 6: Share of person kilometres travelled by train related to the share of apartments, both for 2019
Source: calculated using Odyssee data
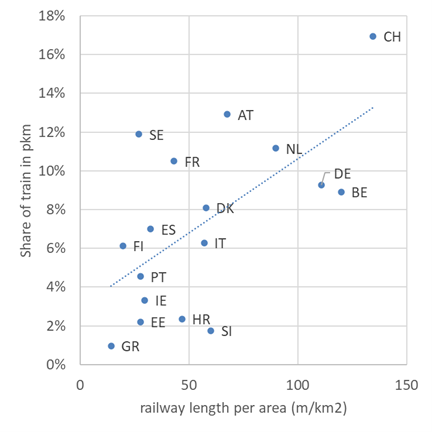
As an extra, a few comparisons with a stronger correlation. Figure 7 shows the share of person km travelled by train versus the railway length per land area. The value of R2 here is 0.39.
Figure 7: Share of person km travelled by train related to the length of railways per area, both for 2019
Source: calculated using Odyssee, Eurostat and Wikipedia data
Figure 8 shows the share of person km travelled by domestic air related to the share of multifamily dwellings. The value of R2 here is 0.3.
Figure 8: Share of person km travelled by domestic air related to the share of multifamily dwellings, both for 2019
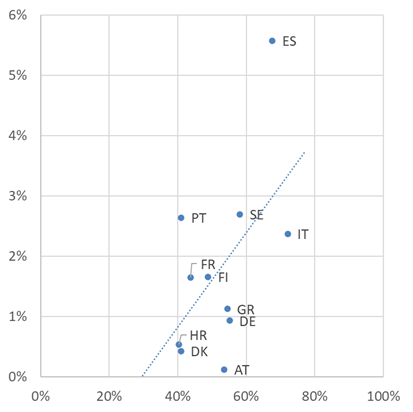
Source: calculated using Odyssee data
Discussion and conclusion
Two questions were posed at the beginning:
- Does energy consumption dependence on urban living show up in the Odyssee database?
- Can differences between countries be used as a measure for energy consumption reduction potential?
The answer to the first question is: a little bit. The answer to the second question is: no. The reason is that the measure for urban lifestyles that we used, the share of apartments in the stock of dwellings, does not explain energy consumption for space heating and mobility very well. There is too much variation between countries to come to an energy reduction potential for countries with relatively high energy use compared to the trendlines.
It was unexpected that climate corrected energy consumption for heating is hardly dependent on the share of urban living when looking across countries, as apartments use less energy for space heating on average than do other dwellings. Apparently, other factors play a more important role. At first sight, it was also unexpected that the number of person km and energy for transport are hardly dependent on the urbanization level, which could have been expected because of expected lower commuting distances.
This leads to two additional questions: is the share of multifamily dwellings a good measure for the level of urbanisation, and is urbanisation level a good measure for energy consumption in dwellings and for mobility?
The first one will not be answered here, but it is known from literature1 that income level plays a large role in energy consumption by individuals, which is relevant for the second question. This is especially true for mobility, as energy use for mobility is much more income elastic than energy for heating. This is why the lack of a strong relation to the share of apartments was unexpected for space heating, but on second thought less so for mobility. An explanation of the higher car ownership and use of domestic flights related to higher apartment shares would be explainable if income levels in urban areas are higher than the national average income level, and indeed this is the case according to Eurostat2.
It could be interesting for follow-up research to find out if limiting the country comparison to larger countries and/or creating different country comparisons for northern, middle and southern countries would result in more significant relations between the level of urbanisation and energy consumption for dwellings and mobility.
Something to consider for the Odyssee-Mure project could be to collect data on car use in built up areas to enable better comparison to local public transport and to collect income data for urban, semi-urban and rural areas to better explain differences between energy consumption in these different areas.
