Summary
Key questions
- What are the main energy efficiency trends and savings in transport in Slovenia?
- What are the main drivers of the transport’s energy consumption variation since 2000?
- What is missing in Slovenian energy efficiency policy for transport sector?
Lead authors: Fouad Al-Mansour and Matjaz Cesen (Jozef Stefan Institute)
Reviewers: Karine Pollier (Enerdata)
Increase of energy consumption up to 2012
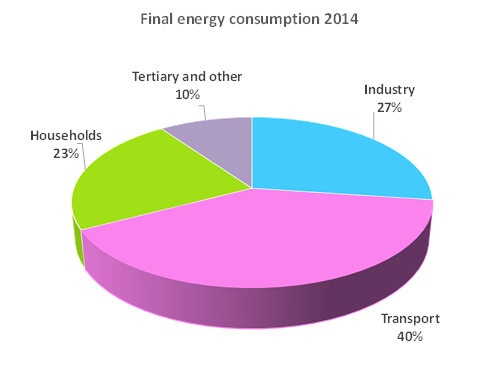
In 2014, transport represented 40% of total final energy consumption in Slovenia (Figure 1) and 51 % of greenhouse gas emissions (GHG) from sources not included in the emission trading scheme (non-ETS). Therefore, the transport sector has a large influence on reaching Slovenia’s climate and energy targets.
Figure 1: Structure of final energy in Slovenia 2014
Source: Odyssee
The final energy consumption of transport has increased (+55%) between 2000 and 2012. The increase observed over the period 2004-2008 was due to a large extent to the accession of Slovenia to the EU, which resulted in a large increase in transit transport through Slovenia. In conjunction with low fuel prices compared to the neighbouring countries (Figure 2), the growth in traffic has increased the fuel consumption in Slovenia. In 2009, the Slovenian government introduced a rebate on excise duty on fuel to the minimal level for truck and buses.
Figure 2: Diesel oil consumer prices in neighbouring countries compared to price in Slovenia (SI = 100)
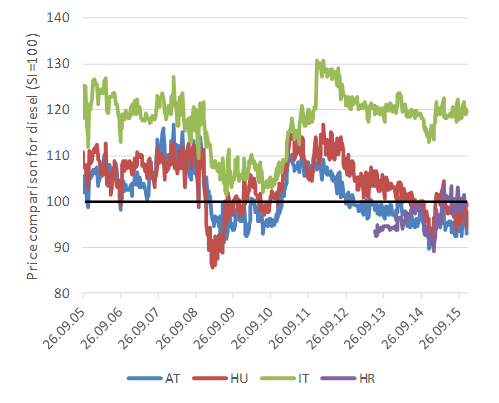
Source: Oil bulletin-AT=Austria;HU=Hungary;IT=Italy;HR=Croatia
The share of diesel in road energy consumption has increased from 28 % to 70 % since 2000 while on the other hand, the share of gasoline decreased from 68 % to 25 %.
Analysis of mileage of different vehicle types driven on state roads and fuel sales in Slovenia revealed diverging trends between the periods 2006 to 2008 and 2009 to 2014 and showed that a portion of the fuel purchased could be attributed to the transit transport of foreign vehicles.
Figure 3: Comparison of trend for final energy consumption of transport in Slovenia and driven kilometres on state owned roads for all vehicles
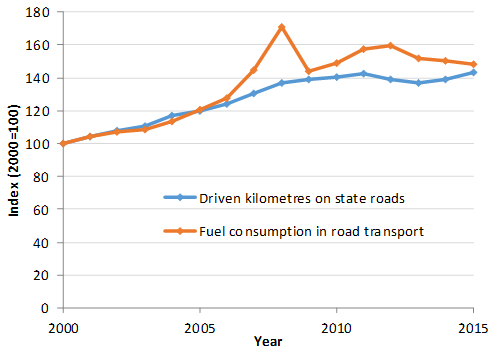
Source: SORS, DRSI
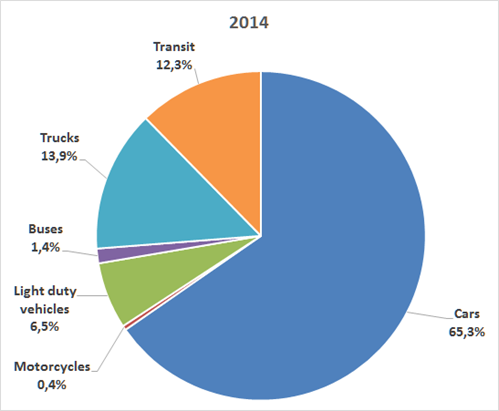
It is estimated that transit (i.e. foreign cars and trucks) represent 12%1 of the final energy consumption in transport sector in Slovenia (Figure 4).
From 2013 onward, fuel consumption in Slovenia slowly decreased mainly due to the decrease in fuel purchases by foreign vehicles. Model calculations show that the fuel consumption of domestic vehicles increased after 2013.
Cars account for the largest shareof the road consumption (65%) followed by trucks (14%), light duty vehicles (6.5%) and buses (1.5%) as shown in Figure 4.
Figure 4: Structure of fuels use in road transport in Slovenia
Source: Odyssee
Energy efficiency measures and policy in transport in Slovenia
Energy efficiency measures in the transport sector have been enacted in two programmes/ strategies:
- Operational programme for reduction of GHG emissions from 2002;
- National action plan for energy efficiency (NEEAP3) from 2008;
The main measures in these two programmes are:
- Promotion of public transport;
- Promotion of sustainable freight transport;
- Improvement in energy efficiency of motor road vehicles and;
- Promotion of cycling with the construction of cycle paths.
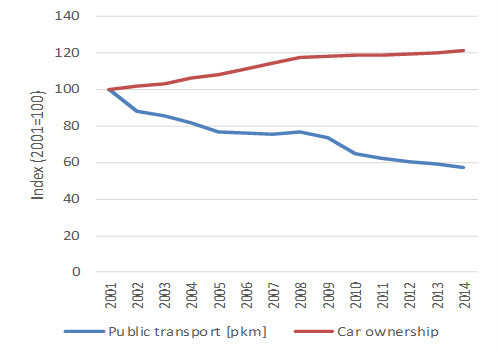
The implementation of these measures has not been very successful, for different reasons. The promotion of public transport (integrated ticket – one ticket for different means of public transport with synchronised timetables) has been delayed several times and was finally implemented in 2016. The use of public transport (in terms of passenger-kilometres) decreased by 43 % between 2001 and 2014. On the other hand, car ownership increased by 20% in that time period (Figure 5).
Figure 5: Trend in public transport use and car ownership in the period 2001-2014
Source: SORS, JSI-EEC
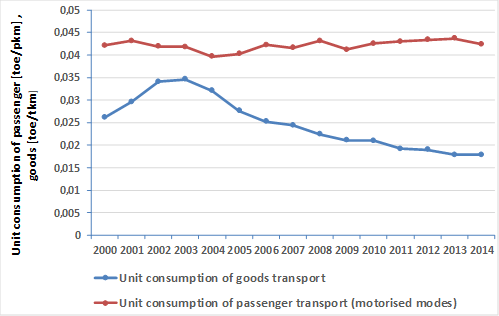
Energy efficiency of motor vehicles can be improved by technical improvements and behavioural changes. Technical improvements in the efficiency of vehicles were offset by the increase in size and power of vehicles until 2014. The large increase in the share of diesel vehicles (more than fourfold increase in the number of diesel cars between 2000 and 2014), that was stimulated by lower diesel fuel prices, also did not bring any benefits as can be seen from the figure (Figure 6). Behavioural changes like efficient driving and car-pooling has not yet been systematically stimulated so there is further potential. Some behavioural changes can be attributed to economic crisis, which forced people to find cheaper means of transport and consequently increase carpooling.
The main target of promotion of sustainable freight transport was to increase or at least to maintain the share of railway freight transport in total freight transport. Maintenance of 25 % share has been achieved, partly due to the economic crisis.
Figure 6: Unit consumption for passenger and freight transport
Source: Odyssee
Future energy efficiency measures in the transport sector are contained in three programmes/strategies:
- Operational programme for the reduction of GHG emissions until 2020 (OP-TGP 2020) from 2014;
- Third national action plan for energy efficiency (NEEAP3) from 2015;
- Transport development strategy (TDS) from 2015.
The measures from these programmes/strategies are the same as in the past and can be grouped into three categories:
- Promoting sustainable mobility measures;
- Improvement of energy efficiency of transport (technical and behavioural);
- Promoting sustainable freight transport.
Under the promotion of sustainable mobility measures, we can find the following measures: establishing safe approaches to public transport stations and stops, cycle paths & parking, park-and-ride (P+R) systems, pavements, suitable infrastructural conditions for sustainable mobility and parking policy measures, the establishment of environmental zones, the use of effective mobility management and educational/awareness raising activities, etc.
In sustainable freight transport, the emphasis is on co-modality for which the construction and the modernisation of existing transport infrastructures (especially railway) is vital.
Slovenia has no direct way for increasing energy efficiency in the production of vehicles. However, Slovenia may influence on the vehicle purchase decision, through fiscal measures and subsidies to stimulate the purchasing of more energy-efficient and environment-friendly vehicles and through taxes on motor vehicles according to CO2 emissions per km. The average CO2 emissions of new cars has been reduced by 15% over the period 2010-2014 to reach 124 gCO2/km in 2014.
Modest energy savings in transport
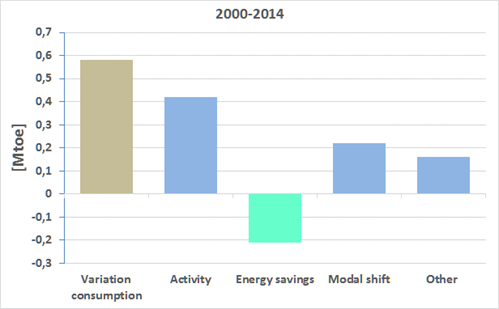
The increasing energy consumption in the transport sector in Slovenia (+0.6 Mtoe since 2000) results from an increase in the activity (more cars and more road transport of goods), modal shift and other behavioural factors. The increase in the car stock was 28% between 2000-2014 and road freight traffic in Tkm was 145% higher in 2014 than 2000. The share of public transport in total land passenger decreased by 45% and the share of rail in total freight transport fell by 33%.
On the other hand, energy savings tended to decrease the energy consumption by around 0.2 Mtoe since 2000 (Figure 7).
Figure 7: Variation transport energy consumption in Slovenia
Source: Odyssee
Energy efficiency improvement in transport in Slovenia
Energy efficiency (as measured by ODEX2) has improved by around 1.2%/year over the years 2000 -2014 (or 15.4%). The improved energy efficiency measured by ODEX is calculated as a combination of energy efficiency improvement of transport of passengers (cars) and goods (trucks and light duty vehicles) and other transport modes (Figure 8).
Figure 8: Energy efficiency progress in transport in Slovenia
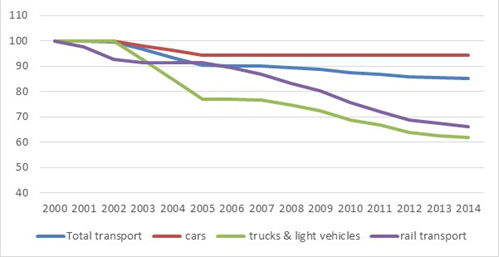
Total transport includes air transport
Source: Odyssee
Analyses have been made excluding transit transport. The largest efficiency gains have been observed for trucks and light duty vehicles with 42% of improvement since 2000. This high improvement can partially be attributed to higher share of heavier tracks and optimisation of trucks usage (reduction of empty kilometres). Worsening of efficiency before 2003 can be attributed to the roughness of methodology that has been used to determine the energy consumed by the transit transport. Rail transport has improved by 33%. The smallest gains have been achieved by cars with only a 7% improvement. Since cars have the largest share in transport energy consumption, they also have the largest impact on efficiency in the transport sector.
Notes
- 1: This share varies between 12 and 22% according to years.
- 2: ODEX is the index used in the ODYSSEE-MURE project to measure the energy efficiency progress by main sector. For the transport sector, the index is calculated as a weighted average of sub-sectoral indices of energy efficiency progress of transport modes (cars, trucks & light vehicles, bus, inland waterways, rail, air for the main modes).
