Summary
Key questions
- How has the energy crisis changed the behaviour of Polish households in the energy market?
- Have energy policies had an impact on improving energy sufficiency?
Lead authors: Dariusz Twaróg (GUS/US Rzeszów)
Reviewers: Lea Gynther (Motiva Oy)
This policy brief discusses, based on Statistics Poland database (https://bdl.stat.gov.pl/bdl/start), the effects of selected programs carried out in Poland that have had a positive impact on improving energy sufficiency.
Introduction
Energy sufficiency is a voluntary approach to reducing energy and resource consumption based on behavioural changes, lifestyle adjustments, and collective organization, in contrast to energy efficiency, which relies on technology. The Club of Rome’s famous Limits to Growth report1 argued that “confidence in technology as the ultimate solution to all problems diverts our attention from the most fundamental problem: growth in a finite system.” Energy sufficiency is one of the three pillars of the energy transition, alongside renewables and energy efficiency. Technology alone cannot be the only solution; transforming our habits and lifestyles is equally vital for the energy transition.
The goal is to build a system where everyone has enough energy to meet their needs and live comfortably, without exceeding the limits of our environment. We can consider energy sufficiency as a state in which our well-being aligns with responsible energy consumption. However, energy production from both renewable and non-renewable sources faces certain limitations. For renewable sources, we encounter challenges such as the inability to construct wind turbines near urban areas, terrain obstacles, and animal (bird) migration routes. Non-renewable sources face depleting deposits and high greenhouse gas emissions. Furthermore, the energy transition to greater use of renewable sources requires a much greater use of rare earth elements than before, and these resources are also limited. Moreover, the extraction of these resources may be limited for political reasons (e.g., the growing influence of China). All of these factors, along with high population growth in some parts of the world, can result in significant limitations in the consumption of energy carriers for each of us. Therefore, the issue of energy sufficiency becomes increasingly important every year.
Sufficiency programs implemented in Poland
Over the past few years, several programs have been launched in Poland2 to improve not only energy efficiency but also energy sufficiency. Participation in the programs involves an energy audit and the information gathered helps to change our daily habits. Among these programs, the most important are:
- “Clean Air3”: This program provides funding for comprehensive thermal modernization of buildings and the replacement of old and inefficient solid fuel heat sources with modern heat sources that meet the highest standards.
- “My Electricity4”: The goal of the program is to increase the production of electricity from micro photovoltaic installations, to enhance the self-consumption of generated electricity through storage and to improve the efficiency of electricity management.
- “Stop Smog5”: The goal of the program is to replace or eliminate high-emission heat sources with low-emission ones, to carry out thermos-modernization of single-family residential buildings, and to connect them to a district heating or gas network.
- “Warm Housing6”: In this program, owners have the opportunity to apply for financial support for the thermal modernization of their buildings. The subsidy covers the purchase of insulation materials and the costs associated with renovation work.
- “My Heat7”: This program supports the purchase and installation of heat pumps for new single-family buildings. It will contribute to reducing emissions resulting from heating single-family houses with inefficient fossil fuel heat sources.
- “Thermo-modernization Fund8”: This fund helps to reduce energy consumption and the associated cost of providing adequate thermal comfort. Most often, this involves insulating the building envelope, replacing or renovating windows, modernizing or replacing the heating system, upgrading the ventilation system, and improving hot water generation.
- “Energy for the Countryside9”: The program aims to increase the use of renewable energy sources in rural and rural-urban municipalities. As part of grant applications, one can apply for investments in the construction of hydroelectric power plants and installations for generating energy from agricultural biogas under conditions of high-efficiency cogeneration.
- “Green public transport10”: The goal of the program is to reduce air pollutant emissions by subsidizing projects involving the use of low-emission solutions in transportation.
Households energy consumption
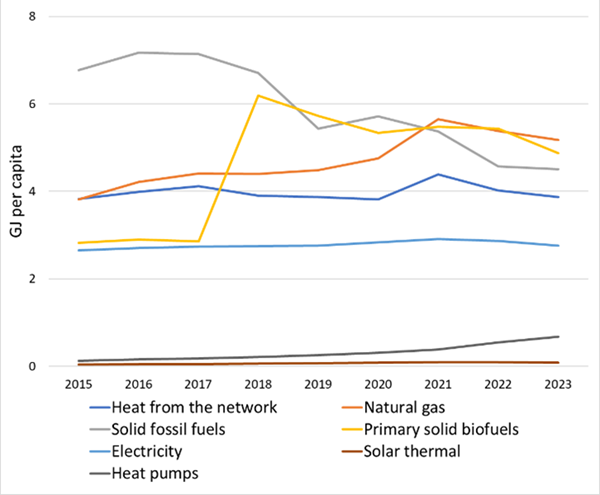
In 2023, the total energy consumption for households reached 22.5 GJ per capita, which is an increase of 10% compared to 2009. During the same period, the number of permanently occupied dwellings increased by 11%. In 2023, the highest share in consumption came from natural gas (23%), followed by biomass (22%) and coal (20%). The 11 percentage point decline in the share of hard coal during the study period was offset by increases in the use of natural gas, biomass, and renewable energy sources (RES). The decline in hard coal consumption was also influenced by thermo-modernization programs started in recent years, such as “Stop Smog”, “Warm Housing” and “My Heat”. Decreases in the consumption of energy carriers were clearly visible after 2021, particularly for hard coal, which saw over a 17% decline in 2023 compared to 2021. In the case of biomass and district heating consumption decreased by more than 11% for each, more than 8% for natural gas, and 5% for electricity (Figure 1).
Figure 1: Energy carriers consumption
Source: Statistics Poland
The apparent declines in consumption were mainly due to increases in the price of energy carriers, especially after 2021 and warmer winters in 2022 and 2023. After imposing sanction on the import of Russian hydrocarbons, Ministry of Climate and Environment launched a public campaign encouraging to save energy. In 2023, the share of renewable energy sources (RES), including biomass, heat pumps, and solar panels, reached approximately 29%, an increase of 13 percentage points compared to 2009. In contrast, the combined share of heat pumps and solar panels was 4%. Energy production from heat pumps increased the fastest, with more than a 5.2-fold increase in the period 2015-2023. In the case of solar thermal, an over 2.6-fold increase was observed. Unfortunately, in 2023, the total share of biomass and coal in heating reached 47%. Such a high use of solid fuels is a negative phenomenon because most of them are still burned in off-grade boilers. According to information from the Central Emission Inventory for Buildings, about 57% of the solid fuel boilers used in 2022 are below class 3 or are classless (Figure 2). Such a low grade results in high emissions of PM10 and PM2.5 particulates into the atmosphere. Eco project boilers emit less than 40 mg of particulate matter per 1 m3 of exhaust gas emissions, while for class three it is more than 150 mg, and for classless installations even more than 400 mg. In the period 2021-2025, more than 864,000 contracts have been signed under the “Clean Air” program, which allows for the replacement of heating sources with more efficient ones (5 class or Eco project). This is quite a success, but still insufficient in view of the huge needs, as more than 60% of the residential area in Poland is in buildings built before 1989 (Census 2021). This translates into a large number of class 3 and non-class boilers, and in the case of using these structures, energy sufficiency manifests itself mainly as a reduction in the use of energy carriers.
Prices of energy carriers
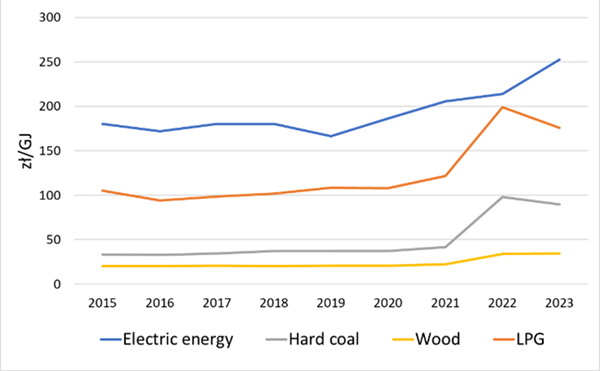
One of the main factors influencing the volume and type of energy carriers used was their price. Before 2020, prices of energy carriers remained relatively stable. A sharp increase in prices was observed from 2021. The largest price increase was for hard coal, with an increase of more than 203% during the review period. This was followed by hot water, with more than a 138% increase. For LPG, there was a 104% increase. Wood remained the cheapest and most readily available energy carrier (Figure 2). Despite significant increases in the price of energy carriers, the percentage share of household expenditures for these purposes remained stable, from 11% in 2021 to 12% in 2023. This stability was made possible by the introduction of several support programs, such as energy vouchers, where the allowance amount depended on the income per person in the household, and by setting maximum electricity prices for households.
Figure 2: Energy prices
Source: Statistics Poland
In order to protect consumers, an “Anti-inflation Shield” was also implemented, under which from January 1 to December 31, 2022 there was a reduced excise tax and reduced VAT rates for the supply of: natural gas (0%), electricity and heat (5%), and the supply of gasoline, diesel fuels, biocomponents, LPG and LNG (8%). On the other hand, from January 1, 2023, they are subject to a 23% VAT rate.
Electricity consumption
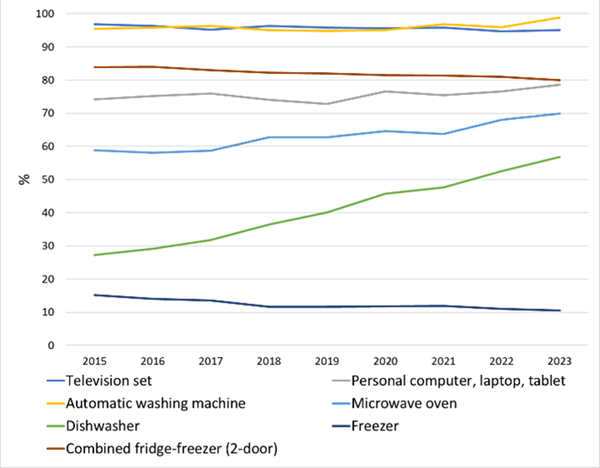
In 2023, the number of electricity consumers will reach 16.36 million, an increase of 43% compared to 2002. For consumption per capita, the increase was more than 39%. The 5% decrease in consumption in the 2021-2023 period was mainly due to the increase in electricity prices. Share of electric energy using to supply electrical appliances and lighting steadily rises in recent years attaining 82% in 2023. According to the results obtained from the Household Budget Survey in 2009, only 12% of households declared having a dishwasher, while in 2023, this percentage increased to almost 57% (Figure 3). If we assume that each dishwasher operates on the ECO program for 100 cycles a year, the annual average electricity consumption would be approximately 75.2 kWh. The share of microwave ovens has increased from over 50% in 2009 to nearly 70% in 2023. Assuming that these appliances operate for only 15 minutes a day, annual electricity consumption reaches more than 73 kWh. For automatic washing machines, it is approximately 51.2 kWh a year, with a 99% share in 2023 (an increase of 10 percentage points during the study period). Freezers are among the most energy-consuming appliances, using around 208.5 kWh a year. However, their share has steadily declined from 20% in 2021 to 11% in 2023. The presented data suggest that the increase in electricity prices has not significantly affected the structure of household equipment. Older devices were replaced with new, often larger ones (such as refrigerators or washing machines). Moreover, the increase in energy class was often compensated by the number of devices.
Figure 3: Households electric appliencies
Source: Statistics Poland
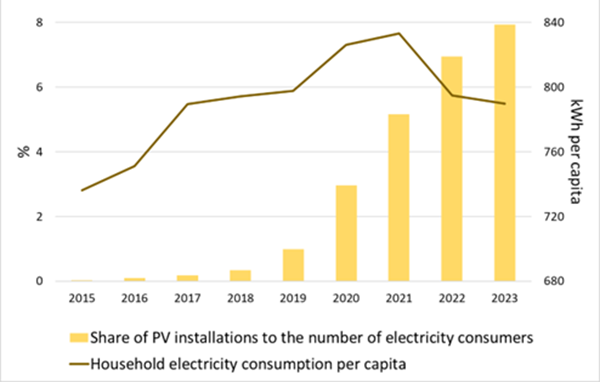
The largest increase in the share (by 4 percentage points) of electricity used to power electrical appliances and lighting was observed in the period 2021-2023. This is the result of a decline in per capita electricity consumption, which was more than 5% in the same period (per apartment it was more than 8%). As can be seen, the decrease in electricity consumption from the grid did not result in more economical use of electrical appliances. This was caused in part by an increase in self-consumption from prosumer PV installations.
Figure 4: Photovoltaics and electric energy consumption
Source: Statistics Poland, Energy Regulatory Office
The development of photovoltaics (PV) in Poland has achieved significant success, largely due to the “My Electricity” program. In 2023, the share of prosumer PV installations relative to electricity consumers was 8% (Figure 4). From 2014 to 2023, the amount of energy provided to the network by PV prosumers increased from about 2.5 GWh to more than 5012 GWh.
New dwellings
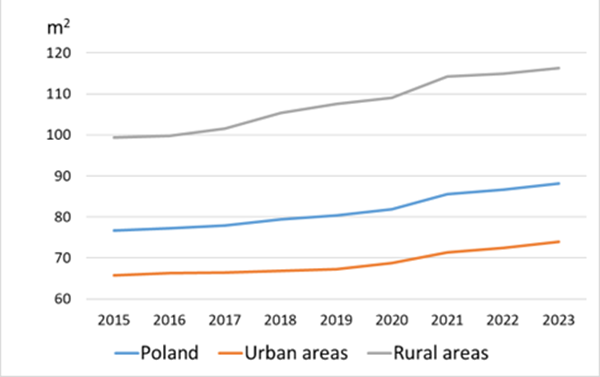
The average area of housing gradually increased, with rural areas experiencing nearly a 24% increase during the study period (Figure 5). In 2023, the total number of housing units was more than 15.5 million, of which more than 13.7 million were permanently occupied. During the study period, household energy demand gradually decreased from 21.3 koe/m² (248 kWh/m2) in 2009 to 17.7 koe/m² (206 kWh/m2) in 2023. This was partly the result of thermos-modernization programs and climate changes (average air temperatures recorded in the period 2009-2023 showed an increasing trend). Energy consumption for space heating also declined at a similar rate, but the share of energy used for space heating remained stable at around 65%.
Figure 5: Average floor area of dwellings
Source: Statistics Poland
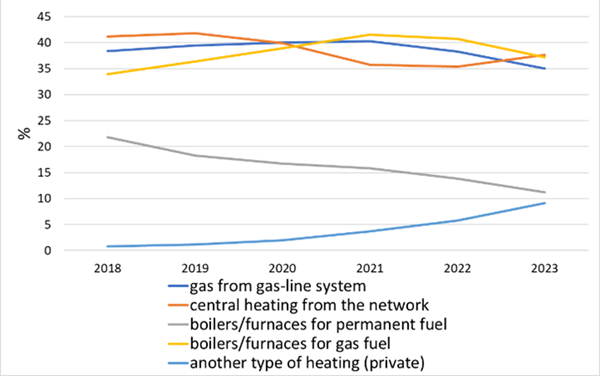
The progress of thermal modernization programs can be better tracked using the example of newly built dwellings. These statistics have been conducted by Statistics Poland since 2018. As can be seen, the share of heat from the network gas from the grid, and furnaces for gas fuel remains stable (Figure 6).
Figure 6: Equipping newly completed apartments
Source: Statistics Poland
A positive trend is a decline in the share of solid fuels and an increase in individual heating sources (mostly heat pumps and solar panels). However, there is significant regional variation (at the NUTS2 level), with the highest increase observed in regions that had the lowest consumption of gas and district heating per capita.
Passenger transport
In 2023, the number of passenger cars reached over 27.2 million. The increase in motorcycle numbers was a bit less dynamic. In Poland, the most popular vehicles were those with small engines powered mostly by gasoline. The share of hybrid and electric vehicles (53 thousand cars in 2023) remained very low despite the implementation of government programs encouraging people to buy electric cars. The number of park-and-ride (Park & Ride) facilities increased from 66 in 2016 to 488 in 2023, in addition there were also 595 interchange hubs. In 2023, the railroad transported more than 373 million passengers, an increase of more than 23.3% compared to 2017. In contrast, car transport saw a decline of more than 32.1% (from 378 million in 2017 to 256 million in 2023). A positive phenomenon affecting energy sufficiency is the development of bicycle roads. This phenomenon has been observed by Statistics Poland since 2015. In 2023, the length of bicycle routes was 6.9 kilometres per 100 km² of area and 5.7 kilometres per 10 thousand residents.
Urban greenery
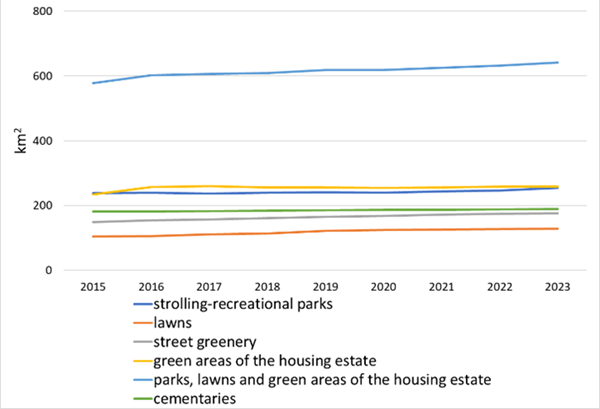
Street greenery minimizes the impact of streets on city inhabitants. From an energy consumption perspective, it is particularly important that greenery can reduce temperatures on city streets during the hot summer months. This should help reduce the use of air conditioning and therefore energy consumption. In recent years, each type of urban greenery shown in Figure 7 has increased in area.
Figure 7: Urban greenery
Source: Statistics Poland
The largest increase, amounting to more than 50% over the study period, was for “street greenery”, followed by “lawns”, which increased by nearly 31%.
Discussion
Energy-sufficient measures have numerous positive impacts on our environment, climate, economy, and well-being". However, the main factor encouraging energy savings is the increase in energy costs, followed by the growing environmental awareness among consumers. During the energy crisis, a number of public campaigns were launched to encourage energy conservation. In Poland, the decrease in energy consumption was clearly visible only for the most expensive energy carriers.
We also have to remember the technological progress that changes our daily behaviours. In recent years, developments in information technology have transformed our approach to various aspects of daily life, such as shopping (e-commerce), food ordering, and using digital public and private services instead of visiting local offices. These forms of service became widespread during the COVID-19 pandemic and became popular mainly among the younger part of the population. Investigating these changes or assessing their impact on energy consumption will require a series of interdisciplinary studies. Energy sufficiency can also be measured by examining phenomena such as energy poverty and energy extravagance, provided that these terms are well-defined.
