Summary
Key questions
- What factors drive the variations in total energy supply and final consumption?
- What are the sectors that achieved the most energy savings?
- How do policies contribute to energy savings?
Lead authors: Bruno Lapillonne, Estelle Payan (Enerdata), Wolfgang Eichhammer (Fraunhofer ISI)
Reviewers: Minas Iatridis (CRES)
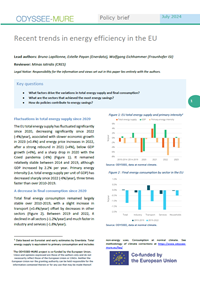
Fluctuations in total energy supply since 2020
The EU total energy supply has fluctuated significantly since 2020, decreasing significantly since 2022 (-4%/year), associated with slower economic growth in 2023 (+0.4%) and energy price increases in 2022, after a strong rebound in 2021 (+4%), below GDP growth (+6%), and a sharp drop in 2020 with the Covid pandemia (-6%) (Figure 1). It remained relatively stable between 2014 and 2019, although GDP increased by 2.2% per year. Primary energy intensity (i.e. total energy supply per unit of GDP) has decreased sharply since 2022 (-6%/year), three times faster than over 2010-2019.
Figure 1: EU total energy supply and primary intensity1

Source: ODYSSEE, data at normal climate.
A decrease in final consumption since 2020
Total final energy consumption remained largely stable over 2010-2019, with a slight increase in transport (+0.4%/year) offset by decreases in other sectors (Figure 2). Between 2019 and 2022, it declined in all sectors (-1.2%/year) and much faster in industry and services (-1.8%/year).
Figure 2: Final energy consumption by sector in the EU

Source: ODYSSEE, data at normal climate.
Most of this reduction can be explained by the surge in energy prices (+70% in industry, almost +40% for households).
A much higher reduction for total supply than for final consumption since 2010
From 2010 to 2022, total energy supply decreased more than final consumption: -215 Mtoe compared to -68 Mtoe (Figure 3). Almost 60% of this difference is explained by changes in the power sector:
- A higher share of renewables (+17 pts) and lower shares of nuclear and thermal (-7 pts each) reduced total supply by 65 Mtoe.
- The improved efficiency of thermal generation (+2.6 pts), thanks to a shift from coal to gas and more efficient plants, contributed to a reduction of 19 Mtoe.
Figure 3: Drivers of EU total energy supply variation

Source: ODYSSEE Decomposition tool2
Faster energy efficiency gains since 2020
At the EU level, energy efficiency of final consumers, as measured by ODEX3, has improved by an average of 1.1% per year since 2000 (i.e. by 22%) (Figure 4).
These improvements have accelerated since 2019 (1.4%/year on average), after a slow progression over 2014-2019. The recent intensification in energy efficiency progress may be partly linked to high energy prices in 2021 and 2022.
Energy efficiency progress has been the strongest for households (31%, 1.7%/year on average). This good result can be explained by the introduction of many regulations affecting buildings and appliances. The industrial sector follows with an average rate of energy efficiency progress of 1.3%/year (24%) since 2000. In this sector, the pace of energy efficiency improvements almost halved after the financial crisis of 2008 until 2019 (0.9%/year on average), compared to the period before and since 2019 (1.8%/year on average). Transport and services lag behind (0.7% and 0.6% per year, on average, respectively, since 2000, two times less than over 2007-2014) because the efficiency of cars was no longer improving due to the penetration of SUVs, and a reverse trend was observed for dieselisation.
Figure 4: Energy efficiency trends for final consumers (EU)

Source: ODYSSEE Energy saving tool4
Around 240 Mtoe of energy savings in 2022
Energy efficiency improvements have led to significant energy savings, estimated at 240 Mtoe in the EU in 2022 compared to 2000 (27% of final consumption) (Figure 5). These savings represent the sum of the additional annual energy savings by sector. Without these savings, final consumption would have been 27% higher.
Figure 5: Energy savings and final consumption (EU)

Source: ODYSSEE Energy saving tool; data at normal climate.
Together, industry and households accounted for 77% of these savings while representing 53% of final consumption. Transport and services lag behind accounting for 16% and 7% of savings, respectively, a share twice as low as their share in final consumption.
Since 2010, energy savings have more than offset increase in activity
Final energy consumption in 2022 was 68 Mtoe lower than in 2010 (Figure 6).
Figure 6: Drivers of final energy consumption variation at EU level between 2010 and 2022
")
Source: ODYSSEE; international aviation excluded.
Economic and population growth, increase in traffic and in the number of household appliances (activity effect5) contributed to an increase in final consumption of 101 Mtoe (35% in industry, 32% from households (17% from demography), and 23% in services). Energy savings more than offset this activity effect and reduced consumption by 127 Mtoe, of which around 40% in households, 30% in industry, 20% in transport, and around 10% in services. Climatic differences between these two years were particularly significant (2022 being much warmer than 2010) and reduced consumption by a further 44 Mtoe.
Progression in energy savings since 2020
Annual energy savings have shown significant variations since 2000 (Figure 7). Between 2000 and 2014, savings averaged 10 Mtoe per year, dropping to 6 Mtoe by 2019. They then increased significantly from 2020 to 17 Mtoe/year, with industry and households accounting for most of these savings (39% and 34%, respectively). The breakdown by sector was roughly the same over 2015-2019.
Figure 7: Average annual additional savings by sector

Source: ODYSSEE
Contribution of energy efficiency policies to energy savings
Energy efficiency policies are critical for achieving climate and energy goals, and their impact must be rigorously evaluated to understand their effectiveness and to guide future policy development.
The evaluation of the impact of energy efficiency policies on the observed energy savings for the period 2010-2020 relied on the MURE database6, which provides comprehensive data on policy measures and their outcomes, and on the Energy Efficiency Scoreboard7, which offers insights into policy impacts over the decade. The impact of energy efficiency policies was estimated at around 4.3 Mtoe/year over this period (Figure 8, on the left). When comparing these policy impacts with the savings derived from ODYSSEE indicators (i.e. top-down approach), as shown in the Figure 7, it turns out that policies accounted for about 50% of the reduction in energy demand. Other influential factors included autonomous changes and behavioural adjustments, particularly driven by high energy prices.
Figure 8: Annual additional savings from policies

Source: MURE, EE Scoreboard, ODYSSEE-MURE Assessment Tool, EU Commission Assessment Draft NECPs, EU Commission Assessment Art. 7
A new policy assessment tool leveraging data from the MURE database and the National Energy and Climate Plans (NECPs) to project future savings is under development. Current projections estimate similar annual savings (around 4.1 Mtoe). An analysis by the European Commission also supports these figures, although they remain to be confirmed with the final NECPs, expected to be submitted by the EU Member States by June 2024.
To meet the European energy efficiency target of 11.7% by 2030, the current projected savings need to be doubled. The assessment includes sectoral splits, highlighting significant contributions from households and transport. Data from Article 7/8 of the Energy Efficiency Directive (on energy efficiency obligations) indicate substantial recent savings, aligning with top-down indicators for 2021 (right column in Figure 8). However, uncertainties persist about the sustainability of these savings.
Conclusions
Since 2020, there is a succession of unusual years, making it difficult to outline trends for the future. We observe, for sure, an increasing decoupling between final and primary consumption, due to the growing share of wind and solar for power generation, with no losses accounted for in primary consumption.
Energy efficiency improvement of final consumers seems to have accelerated since 2020. This is partly due to higher energy prices and may be partially reversible. Improvements have been by far the strongest for households, due to multiple regulations and incentives at EU and national level.
Energy efficiency policies have substantially contributed to past energy savings and are projected to continue playing a crucial role in the future. Nonetheless, achieving the ambitious 2030 targets will require intensified efforts, improved policy measures, and continuous validation of projected impacts. Ensuring these measures are effectively implemented and monitored is essential for realizing the full potential of energy efficiency policies.
Notes
- 1: Data based on Eurostat and early estimates by Enerdata. Total energy supply is equivalent to primary consumption and includes non-energy uses. Consumption at normal climate. See methodology of climate corrections at https://www.odyssee-mure.eu/faq/
- 2: For more information on this decomposition of consumption, see: https://www.indicators.odyssee-mure.eu/decomposition.html
- 3: ODEX is the indicator used in ODYSSEE-MURE to measure the energy efficiency progress by sector. For each sector, the index is calculated as a weighted average of indices of specific consumption by sub-sector, end-use, or transport mode. For more information on ODEX: https://www.indicators.odyssee-mure.eu/odex-indicators-database-definition.pdf
- 4: https://www.indicators.odyssee-mure.eu/energy-saving.html
- 5: Including changes in appliance ownership and larger dwellings.
- 6: https://www.measures.odyssee-mure.eu/energy-efficiency-policies-database.html
- 7: https://www.odyssee-mure.eu/data-tools/scoring-efficiency-countries.html
July 2024


