Summary
Key questions
- Why the building sector is so relevant?
- Which are the different approaches available for the policy maker?
- What about best experiences?
Lead authors: Alessandro Federici, Giulia Iorio and Chiara Martini (ENEA)
Reviewers: Alenka Kinderman Lončarević (EIHP)
Different types of policy measures are available for policy makers to increase energy efficiency in buildings and their success can be assessed basing on several criteria and taking into account country specific conditions.
Incentive measures for buildings at the core of the policy strategy
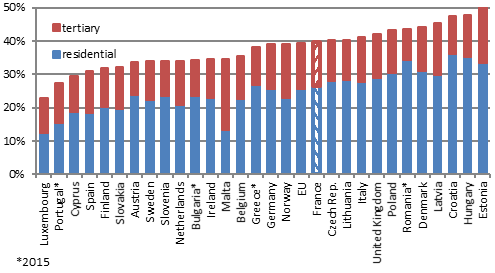
National final energy consumption data clearly shows the relevance of residential and services buildings in terms of share in total energy consumption. In most European countries buildings are the largest end-use energy consumption sector: in 2016, the share of the consumption in buildings is over 35% in 16 countries (11 of them have a share over 40%) (Figure 1).
Figure 1: Residential and tertiary buildings consumption by country (% of total final consumption - 2016)
Source: ODYSSEE
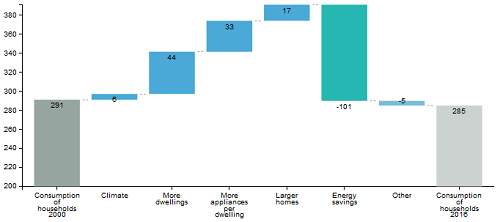
The limited growth in building energy consumption of EU28 (+5.4% between 2000 and 2016), is due to energy efficiency improvements that counterbalanced the raise in energy consumption caused by more dwellings and appliances and the increase of services activity. Energy savings in buildings reached around 110 Mtoe since 2000 (100 Mtoe for residential, 10 Mtoe for service sector), that is to say about 27% of EU energy consumption in 2000 (Figure 2).
Figure 2: Variation of households consumption in EU (Mtoe, 2000-2016)
Source: ODYSSEE
This clearly implies buildings have a key role in national energy and decarbonisation strategies. Relevant EU regulations which are represented by EPBD Directive1 (31/2010) and EED Directive2 (27/2012) are particularly relevant for policy making and monitoring.
According to art. 7 of EED Directive, each country can choose its own approach to reach the national indicative energy saving objective set at EU level for 2020, by combining an energy efficiency obligation scheme with alternative measures. Moreover, energy or CO2 taxes are listed as admissible measures.
The incentive measures in households and services sectors examined here have been divided in four categories (Table 1). In particular, the two direct categories involve end-users, while indirect measures may be relative to energy providers also, through market-based instruments.
Table 1: Classification of incentive measures for buildings
|
|
Direct |
Indirect |
|
End users |
Financial: Grants and subsidies |
Cross-cutting3: Energy and CO2 taxes |
|
Energy providers |
|
Cross-cutting: Market-based instruments |
Source: ENEA elaboration on MURE database
Around 140 incentive measures in the EU
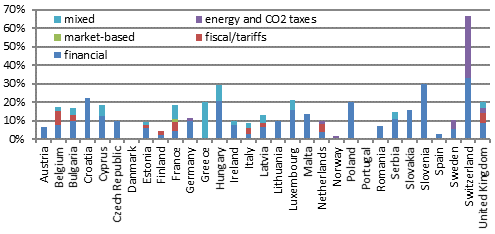
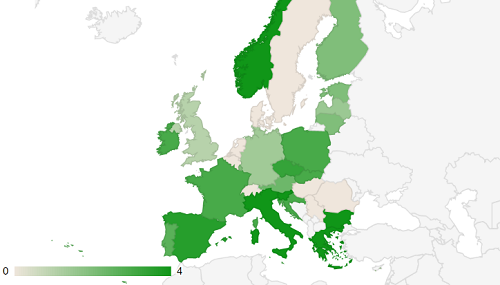
In the MURE database4, the number of incentive measures is 142, i.e. 13% of total households and services measures. All countries implemented financial measures, 9 countries have approved fiscal schemes, 4 countries a market-based scheme such as white certificates, and Sweden a taxation scheme (adopted also by Norway and Switzerland) (Figure 3).
Figure 3: Financial, fiscal-tariffs, market based and taxation measures by country in households and services sectors (%)
Source: MURE
The type of the chosen measure depends on the target, simplicity of application, and taxation system.
According to the MURE database, 49 out of 141 measures have a high semi-quantitative impact5 (35%); 24 of these measures comply with art. 7 of the EED (Table 2).
Table 2: Direct and indirect incentive measures by semi-quantitative Impact and art.7 (art.7 in parenthesis)
|
|
Direct |
Indirect |
Total |
|
|
Semi-quantitative impact |
High |
43 (20) |
6 (4) |
49 |
|
Medium |
32 (14) |
2 (1) |
34 |
|
|
Low |
22 (12) |
0 (-) |
22 |
|
|
Unknown |
37 (4) |
0 (-) |
37 |
|
|
Total |
134 (50) |
8 (5) |
142 |
|
Source: ENEA elaboration on MURE database
Successful measures
Among the measures identified before, the MURE database allows to search successful measures by sector, targeted end-use and country. A specific tool has been developed to define and identify successful energy efficiency policies, according to different criteria, among which is Ease and stability of re-financing. For the household sector, around half of the incentive measures (64) correspond to this criterion and have therefore a sustainable financing. The tool also provides a score for each country. Four successful measures are described below with high semi-quantitative impact and adopted to meet the EED art.7 targets. They provide examples of the different approaches available for policy makers.
Figure 4: Successful measures in the household sector for ease and stability of re-financing
Source: MURE database
Different approaches for the policy makers
Untapped and cost-effective potential for energy savings in the building sector is still large, and energy efficiency measures imply multiple benefits as job creation, health improvements and fuel poverty alleviation of people, higher competitiveness of businesses and, more in general, a better energy security of the country.
Incentives may constitute an effective way to address market failures, such as technical and financial barriers as well as limited information and non-aware behaviour. More specifically, incentives may cover part of high upfront costs, shortening payback times and lowering credit risk, thus facilitating access to credit and attracting capitals of ESCOs in the case of non-residential buildings.
A predefined set of eligible interventions is often provided and regularly updated, and end-users implement at least one of them, gaining a financial or fiscal incentive. In this context, policymakers may orient energy efficiency market towards most cost-effective interventions, facilitating the penetration of new and more energy efficient technologies.
Policymakers may act on building sector in an indirect way also, within more general schemes such as energy taxes or market-based instruments, not necessarily implemented on buildings only. Energy and CO2 taxes make energy savings more attractive, by changing behaviour or by investing in energy-saving technologies, but it is difficult to separate these effects, as taxes interact with other measures. In the case of market-based instruments, the general principle is that the energy savings occur where they are most cost-effective: in terms of payback times and/or volumes of achievable energy savings, measures on the building envelope and/or heating/cooling systems are less attractive (yet), compared to those on lighting and energy intensive processes in the industry sector.
# Grants: KfW programmes in Germany
For residential buildings, the KfW bank offers either a loan or an investment grant to promote energy efficient refurbishment. Their level depends on the level of efficiency reached, compared to new building standards. If the cost of a complete refurbishment is too high, it is also possible to implement only individual measures. The support is dependent on the chosen refurbishment standard. The best standard receives the highest support. In the view of the EED Article 7 implementation, a cumulated energy saving of around 6 Mtoe/year (more than 13% of the target) is expected by 2020.
Through the investment programmes in municipalities and social facilities, KfW offers loans for the renovation of schools, school sports halls, day nurseries and buildings used for work with children or young people. A cumulated energy saving of around 0.2 Mtoe/year is expected by 2020.
# Tax deductions: 65% “Ecobonus” in Italy
Tax deduction is foreseen for a predefined list of energy efficiency measures. Tax deduction raises to 70%-75% for energy efficiency interventions carried out on the common parts of a building, with the maximum amount of 75% for measures aiming at improving the overall winter and summer energy performances of the building.
The investments activated in the 2014-2016 period equalled around 9.5 billion euros: more than 40% of resources were allocated to the replacement of windows and shutters; 25% to the thermal insulation of slabs and roofs; slightly more than 9% to the reduction of energy demand for heating the whole building. Achieved (deemed) savings are equal to around 3,300 GWh/year.
Around 80% of investments activated in 2016 (2.6 billion euros out of 3.3) were devoted to buildings built before the ‘80s (of which more than 810 million euros on buildings built in the ‘60s).
# Energy and CO2 taxes: Sweden, Switzerland and Netherlands
In Sweden, the energy tax was introduced in the 1950s and the CO2 tax was introduced at the time of the great tax reform in 1991. In 2007, an econometrical analysis was made of the effects on energy efficiency stemming from energy taxation in the household sector from the period 1991 to 2016.
In the Netherlands the energy tax is levied on electricity, natural gas, heating oil and LPG. Energy consumers are partly compensated for the taxation. A fixed reduction is refunded by the energy company for every electricity connection. Because of the fixed amount, the compensation is relatively high for energy efficient consumers and relatively low for inefficient consumers.
In Switzerland, since 2008, a CO2 levy has been levied on thermal fuels (oil, gas, coal). Two-thirds of the revenue from the levy is redistributed annually to the public and the economy independently of consumption. One-third (max. CHF 300 million) constitutes an invested program to promote CO2-reduction measures in buildings. Energy-intensive companies can be exempted from the CO2 levy if they commit to reducing emissions.
# Market based instruments: Energy Saving Certificates(ESC) in France
Introduced in 2005 with the aim of achieving energy savings in various sectors, this Energy Saving Obligation scheme obliges energy suppliers and fuel retailers (“obligated parties”) to save energy by encouraging consumers (households, local authorities or companies) to reduce their energy consumption. Obligated parties can choose to partly or totally delegate their obligation to a third party. The amount of energy savings that must be reached by each “obligated party” depends on the type and volume of energy sold for a given period.
To ease the implementation of common energy-saving actions, a catalogue was built to assess the potential energy savings of the different “standardized actions”. The catalogue is frequently updated. Nevertheless, ESC can also be delivered to specific actions that are not included in the catalogue, such as heat recovery or relamping6.
The possibility for “obligated parties” to invest in projects tackling fuel poverty was introduced in 2010, and mandatory actions targeting households in energy poverty situation were set in 2015. More specifically, “obligated parties” must implement energy saving actions targeting housing or transport of low-income households.
The residential sector is still the main targeted sector with 49% of all ESC delivered since 2015 (and 18% for tertiary buildings). The scheme has speeded the launch of refurbishments, pushed to choose more efficient materials and equipment, to call for professionals rather than do refurbishment works on their own.
Notes
- 1: Energy Performance Building Directive (EPBD)
- 2: Energy Efficiency Directive (EED)
- 3: Cross cutting with sector specific characteristics
- 4: https://www.measures.odyssee-mure.eu/
- 5: Semi-quantitative impacts based on expert estimates: high impact measures are measures saving more than 0.5% of the sector energy consumption (medium impact for measures saving 0.1% to less than 0.5% and low impact for measures saving less than 0.1%).
- 6: To help stakeholders optimize their process, a methodological guide for specific operations is available.
