Summary
Key questions
- Through which mechanisms does the EU Emission Trading Scheme ETS promote energy savings?
- How can we identify energy savings from the EU ETS through top-down indicators as provided by ODYSSEE?
- Is there quantitative evidence that the EU ETS promotes energy efficiency?
This policy brief discusses, based on the Odyssee and MURE databases, through the use of energy efficiency indicators how the EU ETS may have promoted energy efficiency progress in the EU in the period 2005-2019/2020.
Lead authors: Wolfgang Eichhammer and Mara Chlechowitz (Fraunhofer Institute for Systems and Innovation Research ISI)
Reviewers: Regina Betz (ZHAW), Samantha Morgan-Price (Ricardo)
The EU Emission Trading Scheme
Next to the Directive for Energy Efficiency (EED), the European Emission Trading Scheme (EU ETS) is another important tool to encourage energy savings in the industrial and energy sectors. Although the EU ETS’s primary aim is to reduce Greenhouse Gas (GHG) emissions, it also has an impact on energy efficiency. It is therefore important to understand how the EU ETS and the EED interact, and how the EU ETS promotes energy efficiency. This policy brief therefore analyses what the main interacting mechanisms between the two instruments and then set up a detailed top-down approach based on the ODYSSEE indicators (www.odyssee-mure.eu) to establish energy savings from the EU ETS.
Launched in 2005, the EU ETS covers GHG emissions from factories, power plants and other emissions intensive installations. Domestic aviation (intra-Euro¬pean flights only) entered the system by 2012. The system works on the "cap and trade" principle. This means there is a "cap", or limit, on the total amount of certain GHG that emitters covered can emit.
Within this cap, companies receive emission allowances that they can sell to or buy from one another as needed. The limit on the total number of allowances available ensures that they have a value. At the end of each year each company must hand in enough allowances to cover all its emissions, otherwise heavy fines are imposed. If a company reduces its emissions, it can keep the spare allowances to cover its future needs or else sell them to another company that is short of allowances. The flexibility that trading brings ensures that emissions are cut where it costs least to do so. The number of allowances is reduced over time so that total emis¬sions fall. In 2020, the emissions cap was set to 21% lower than in 2005.
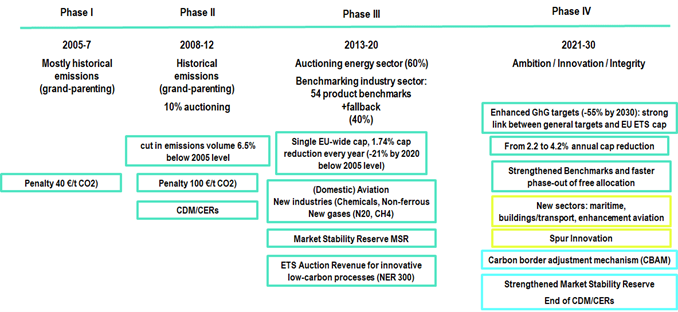
The three different phases of the EU ETS in the time period 2005-2020 (Phase I-III) and their main allocation principles are shown in Figure 1. The EU ETS is now entering its fourth phase, starting 2021 with much larger number of elements.
Figure 1: The three phases of the EU ETS in the period 2005 to 2020

Source: own compilation
Phase IV aims to increase ambition by:
(i) Aligning emission reductions from the EU ETS to EU emission targets (2030: -55% and climate neutrality by 2050);
ii) Assuring a sufficiently high carbon price (ambitious benchmarks, larger amounts of auctioning);
(iii) Considering a Carbon Border Tax Adjustment to establish a level playing field world-wide.
Phase IV further strengthens innovation (by introducing the large-scale Innovation Fund for low-carbon technologies).
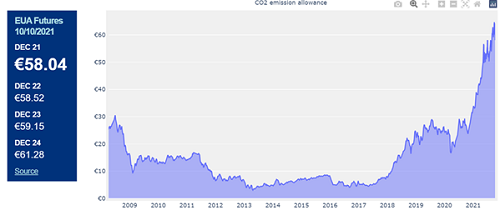
Figure 2: Evolution of EU ETS allowance prices 2008-2020

Source: Sandbag (2021)
This is further accompanied by further instruments such as the Modernisation Fund for power plants in Eastern Member States, as well as a Social Fund to counteract to distributional effects in society). Finally, the phase to come will enhance integrity of the scheme by strongly enhancing the role of the Market Stability Reserve (MSR).
Given that the EU ETS is about to enter this new phase, the question now arises, whether the EU ETS has triggered energy efficiency improvements in the 15 years of its existence.
The main lever of the EU ETS is the allowance price, shown in Figure 2. Except for the early Phase I, prices were low through roughly a decade, and only rising starting 2019 due to the reforms applied to the EU ETS (lowering the cap, creating of the Market Stability Reserve MSR).
How the EU ETS impacts potentially on the improvement of energy efficiency
In this section we describe the impacts which the EU ETS may have in the industrial sector, the energy sec¬tor and the aviation sector in terms of energy efficien¬cy or energy consumption. Besides such impacts on energy issues, the EU ETS may have further impacts in these areas, for example on the introduction of innovative low-carbon technologies. However, such long-term impacts are not considered here.
Impacts of the EU ETS in the industrial sectorThe ways in which the EU ETS may impact energy efficiency of industry are listed below. The first two, which apply to the industrial sector are directly linked to energy efficiency. Number 3 results from the fuel shift effect only (see discussion further on this links to number 1). Finally, Number 4 comes from the impact on the demand for energy within industry.
- Fuel efficiency improvements in industrial sub-sectors covered by the EU ETS;
- Electricity efficiency improvements in ALL industrial branches, including non-ETS industries, due increased costs of CO2 being passed on into electricity prices;
- Enhanced fuel shift towards less CO2-intensive fuels in the industrial sector (e.g. more use of natu¬ral gas and electrification of processes, increased penetration of renewables RES in ETS Industries);
- Reduction in production volumes (due to the shift of production volumes outside Europe).
Based on the ODYSSEE Indicators the effects 1-3 can be considered in the present analysis while effect 4 cannot be dealt with in the frame of this research. We will briefly discuss this issue based on literature research.
Impacts of the EU ETS in the energy sectorThe EU ETS may also have the following impacts in the energy sector (here limited to the power sector). These are all directly linked to energy efficiency or the demand for energy:
- Energy efficiency improvements in thermal elec¬tricity generation by fossil fuels (natural gas, coal, oil);
- Enhanced penetration of more efficient power plants: more efficient fossil power plants (in particular gas plants) or enhanced penetration of renewables into electricity generation;
- Reduction in the demand for electricity across ALL sectors due to the pass-through of CO2 prices onto electricity prices;
- Change in the dispatch of power plants. This implies that less carbon intensive fuels such as natural gas or renewables (which are more efficient than solid fuels or oil) are used more intensively in the daily dispatch of power plants compared to oil and coal.
The ODYSSEE Indicators can be used to understand all of these effects, except number 8 in the frame of this research. We will briefly relate the results from another work in a later section.
Impacts of the EU ETS in the aviation sectorThe EU ETS may have the following impacts in the aviation sector. These are both directly linked to ener¬gy efficiency and the demand for energy:
- Energy efficiency improvement in fuel consumption for aviation purposes
- Modal shift from (domestic) air traffic towards less CO2-intensive transport modes
Based on the ODYSSEE Indicators both the evaluation of the effects 9 and 10 is possible; however, the inclusion of the air transport into the EU ETS only started in 2012 and was finally limited to domestic air transport (i.e. intra-European flights).
Methodology
The following methodological approach was carried out based on the construction of a counterfactual scenario (i.e. a development of without the introduction of the EU ETS) with the help of a linear regression analysis:
- The counterfactual without EU ETS was deduced using data from the years 1995-2004, prior to the introduction of the EU ETS (which was introduced in 2005). First, we choose this period because it was free from major structural changes which characterised the period from 1990-1995. These comprised, in particular, the political changes in Eastern Germany and Eastern Europe. Second, this period is sufficiently long to average out the impact of changes in the economic development (impact of economic cycles). From this period, we also deduce a standard deviation from the annual fluctuations around the linear trend line. These annual fluctuations are mainly (but not exclusively) influenced by business cycles.
- The counterfactual was then projected to the period 2005-2019/2020, which covers Phase I, Phase II and nearly fully Phase III of the EU ETS. The basic idea is that the factors which have induced energy efficiency improvements in the period 1995-2004 may have continued in the period 2005-2019 while the EU ETS has come into force. However, this period was influenced by two major events: the financial and economic crisis which started in late 2008 and influenced in particular the year 2009. Second, this period was dominated by strongly fluctuating energy prices which also may have had an impact on energy efficiency, though the periods of high prices were generally too short to trigger strongly long-term investment in energy efficiency.
- The spread in data during the reference period also allows determining a standard deviation which helps to establish whether any effect found for the EU ETS is significant.
- In the case of energy efficiency improvements, we corrected for fluctuations in the business cycle.
- In addition, further policies have to be taken into account such as dedicated policies for renewables (e.g. feed-in/premium tariffs, obligation schemes, auctions). It was not possible in the frame of the methodology chosen to separate the impacts of different policies contributing to the same effect, the results related here present hence an upper limit for the impacts of the EU ETS on energy efficiency.
- The ODYSSEE indicators do not distinguish between industries which are part of the EU ETS and those which are not. However, there are four sectors in the ODYSSEE indicators which are mainly covered by the EU ETS and which represent a large share of the EU ETS emissions (excluding the power sector, refineries and coking plants, which all belong to the transformation sector from an energy balance point of view). These branches are:
- Primary metals (mainly iron/steel and non-metallic minerals)
- Non-metallic minerals (cement, glass, bricks, ceramics)
- Chemicals (e.g. steam crackers)
- Paper industry
The fuel consumption of these four sub-sectors represents therefore a good proxy for the sources of direct CO2 emissions of the industrial part of the EU ETS. Any improvement in the fuel efficiency of these branches may therefore be linked to the EU ETS. One way of verifying the quality of the proxy is to compare the CO2 emissions calculated from the energy consumption of the above sectors with the emission data published in the European Union Transaction Log (EUTL). There is a reasonable agreement between the two data sets (deviation of 2% in 2019).
Results of the analysis
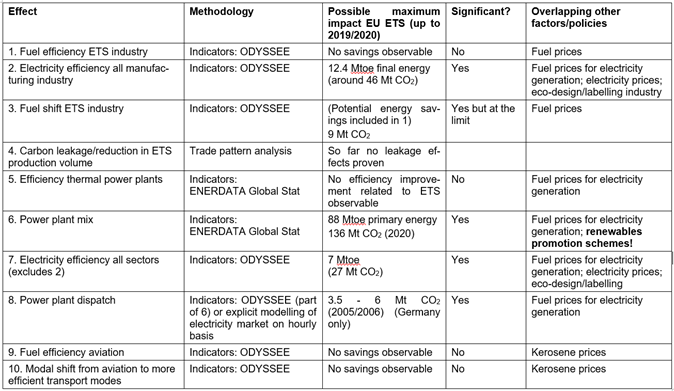
Table 1 presents a summary of results for the possible impact of the EU ETS on the different effects introdu¬ced in the previous section. For a variety of effects impacts can be identified. It is important to empha¬size that these are maximum effects the EU ETS could have has and that in reality, they will also result from overlap with other factors. In particular promotion schemes for renewables, as well as changing fuel or electricity prices. Impacts in terms of energy savings were converted to CO2 with average emission factors.
The following observations can be made from the analysis of the individual effects:
Table 1: Summary of results for the possible impacts of the EU ETS on the different effects in the period 2005-2019/2020

- Effect 1 - fuel efficiency in ETS industry (Figure 3): No fuel savings observable in industry due to the EU ETS. The trend in savings as determined from the baseline 1995-2004 has been interrupted by the economic and financial crises in the years 2008/9 and following years. After this period of time, the fuel savings continued with a similar path as during 1995-2004 up to 2019. This is also confirmed by in-depth studies on selected industries such as iron/steel and cement (Eichhammer et al., 2018).
- Effect 2 - electricity efficiency in ALL industrial sectors, also outside the ETS industries (see Figure 4): Significant electricity savings are observable in industry. However, there is most likely a strong impact from eco-design and labelling policies in industry which have had strong impact on cross-cutting technologies such as electric motors. One step forward could be taken in the analysis by separating cross-cutting technologies from process-specific technologies. However, no long-term data series are available for this analysis.
- Effect 3 - fuel shift in ETS industries (see Figure 5): Potential energy savings from the use of more efficient fuels are already included in Effect 1. There¬fore, this effect has only (potential) additional im¬pacts in terms of decarbonisation of the fuel supply. This is expressed as the average emission coefficient for the fuels used in industry. However, the analysis shows that the observable effects are at the limit of sensitivity (though the use of biomass seems to have increased under the impact of the EU ETS).
- Effect 4 - carbon leakage/reduction in EU ETS production volumes: The possible impact of the EU ETS on production volumes of products in manu-facturing industries and the possible shift of production to outside Europe (carbon leakage) cannot be dealt with the methodology of the ODYSSEE indicators. Also, the effect arises from reduced activity levels, which in the industry sector may be less desirable. IEA (2008) did not find significant carbon leakage during the first phase of the EU ETS.
The sectors examined by the IEA – steel, cement, aluminium and refineries – showed no marked changes in trade flows and production patterns.
Explanations advanced by IEA (2008) on this issue are that carbon leakage may have not occurred during the first EU ETS trading period due to the free allocation of allowances, as well as the still functioning long-term electricity contracts that have scattered rising electricity prices at the time. The largely free allocation to ETS industry has been valid up to 2020 (Phase 3), despite the introduction of benchmarks (Healy et al., 2018) and will continue to 2030, though linked to more stringent features. - Effect 5 - efficiency thermal power plants (see Figure 6): The potential effect is measured through the average efficiency of thermal power plants (notably oil, natural gas, coal/lignite and biomass). While efficiency improvements are observable, they are lower during the EU ETS phases than the baseline, implying that the EU ETS was not a driving factor. This may be explained by the fact that the efforts of supplier shift increasingly away from improving technology to be phased out, as well as by limitations in technology to improve further.
- Effect 6 - shift towards a more efficient power plant mix (see Figure 7): This effect is by far the most observable. It is expressed as the average efficiency of the power sector which raised by 10 points, leading to substantial primary energy savings. However, dedicated policies for renewables such as feed-in tariffs and obligation schemes will have played a major role in the related primary energy savings observed. Previous EU ETS impact assessments concluded on a relatively large contribution to the shift observed towards renewables. Nevertheless, given the relatively low EU ETS prices in most of the period up to 2018, it is doubtful that the effect is so large. Only starting from 2018, the relatively steep decline of lignite and coal on the power sector could be related to the strongly increasing EU ETS allowance prices. At higher price levels, impacts could be higher, as evidenced by investigations on the UK carbon tax (Abrell et al., 2019)
- Effect 7 - electricity efficiency in all sectors except manufacturing industry, already considered in Effect 2 (see Figure 8): In addition to the energy savings observed in industry, there are some significant savings observable for other sectors. Nevertheless, the same remark applies than for industry. Stronger eco-design standards and labels, as well as top-runner programmes for electric appliances in households and the services sector could explain those additional savings as compared to the regulation during the base period 1995-2004.
- Effect 8 - efficient hourly power plant dispatch: One central impact of the EU ETS in the power sector is the change in plant dispatch caused by higher generation cost for CO2-intensive generation technologies due to carbon pricing. This implies that less carbon intensive fuels (such as natural gas or renewables) are used more intensively in the daily dispatch of power plants instead of oil and coal. RES policies have an impact as they prescribe a general priority for renewable energy sources in the dispatch. The EU ETS therefore has an impact on the dispatch of less carbon-intensive fossil fuels, rather than on the dispatch of renewables. Such effects are included in effect 6 representing the change in the power plant mix and cannot be easily separated on an annual basis from investment effects such as enhanced invest¬ments in renewables.
- Effect 9 - fuel efficiency in domestic aviation (see Figure 9) and Effect 10 - impact on modal share of domestic aviation: no additional savings/impacts are observable from the EU ETS on the fuel efficiency or on the (domestic) aviation share in modes. For modal shift, the impact of the economic/financial crises in 2008 is visible. However, aviation eventually reaches a similar change in the period 2013-2019 to that seen in the counterfactual baseline period (excluding the period of economic down-turn).
Conclusions
In total, the analysis found maximum energy savings from the EU ETS of around 107 Mtoe and CO2 savings of around 218 Mt CO2 over the period 2005-2019/2020. In terms of the potential for the EU ETS to have delivered these savings, this mainly stems from Effect 6, the power plant mix. Some parts of these savings are, however, not significant or are, with large probability, partially or even largely influenced by other factors. Rather than the EU ETS, it is like that renewables policies or fuel prices were stronger drivers of these savings. With quite some certainty, it can therefore be concluded that these figures are probably largely overestimating the possible impacts of the EU ETS on energy efficiency.
Annex: Detailed Results EU ETS Impact on Energy Efficiency
More figures are available in the PDF document.
Sources
- Abrell, J., Kosch, M. and Rausch, S. (2019): How Effective Was the UK Carbon Tax? A Machine Learning Approach to Policy Evaluation. Working Paper 19/317, April 2019. CER-ETH – Center of Economic Research at ETH Zurich. https://ethz.ch/content/dam/ethz/special-interest/mtec/cer-eth/cer-eth-dam/documents/working-papers/WP-19-317.pdf
- ENERDATA Global Stat. https://www.enerdata.net/research/energy-market-data-co2-emissions-database.html (commercial database)
- Eichhammer, W., Friedrichsen, N., Healy, S. and Schumacher, K. (2018): Impacts of the Allocation Mechanism Under the Third Phase of the European Emission Trading Scheme. Energies 2018, 11(6), 1443. (Open Access)
- Healy, S., Schumacher, K. and Eichhammer, W. (2018): Analysis of Carbon Leakage under Phase III of the EU Emissions Trading System: Trading Patterns in the Cement and Aluminium Sectors. Energies 2018, 11(5), 1231. (Open Access)
- IEA (2008). "Issues behind Competitiveness and Carbon Leakage- Focus on Heavy Industry. IEA information paper". International Energy Agency (IEA). pp. 122.
- Sandbag (2021). https://sandbag.be/index.php/carbon-price-viewer/


