Summary
Key questions
- How to measure energy sufficiency?
- Which policies and measures can be used to address energy sufficiency and how they are used in Europe today?
This policy brief discusses energy sufficiency indicators and policies in the households, transport, and services sectors and provides examples how sufficiency policies can complement energy efficiency policies.
Lead authors: Lea Gynther (Motiva Oy)
Reviewers: Wolfgang Eichhammer (Fraunhofer Institute for Systems and Innovation Research ISI)
Why Energy Sufficiency?
Today, increasing attention is being paid to energy sufficiency. It is becoming evident that mere energy efficiency and technical emission reduction measures, such as renewables and Green Hydrogen, are not reaching the climate goals and actual reductions in energy consumption will be necessary. At the same time, there is a need for just transition to sustainable energy systems, where various social considerations need to be taken into account.
Energy sufficiency is a relatively new term. Most commonly it refers to a situation where everyone has access to the energy services they truly need, not just want, whilst the impacts of the energy system do not exceed environmental limits. Energy sufficiency is more ambitious in character than energy efficiency which relates the energy inputs to output of goods and services aiming to produce these with minimum energy. (Darby & Fawcett 2018)1
Measuring Energy Sufficiency
At the macro level, studies have been made to link energy consumption to well-being, such as the human development index. A recent meta-analysis of 18 studies aimed to identify a point where increased energy consumption no longer correlates with increased well-being (Burke 2020)2. Energy sufficiency values ranged from 60 to 221 GJ/capita/year (on primary energy basis) with a mean of 132 GJ. This was almost the same as the average level 133 GJ/capita/year in Europe in 2018. This suggests that, on average, Europe has reached a point where increased energy consumption would no longer raise wellbeing.
The study also mentions a policy example of Switzerland which aims for “2000 W society”, corresponding to 63 GJ/capita/year. At the European level, this would mean about halving the current average. A further reference was made to the UN Secretary General’s Advisory Group on Energy and Climate Change, which suggests that modern needs could be met through an aggregate energy use of around 37 GJ/capita/year (26 GJ of final consumption). None of the European countries reaches this very ambitious level at present.
Macro level data is not adequate to facilitate policy making and sufficiency needs to be monitored also with sectoral indicators. These typically address the root causes of energy consumption, i.e., various service volumes such as floor areas per user or travelled mileage. Such data is systematically collected in the Odyssee database. More detailed indicators measure the ways in which the services are produced, such as details of the building stock, transport modal split or passenger load factors in cars.
Energy Sufficiency Indicators for Households in the Odyssee Database
The Odyssee database provides data on the average floor area per person, per dwelling and per new dwelling as well as the share of impermanently occupied dwellings, number of persons in permanently occupied dwellings and number of appliances per household.
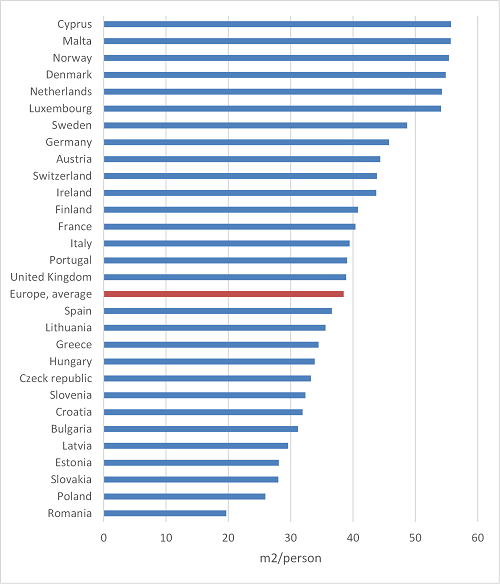
The level of the indicator “floor area per person” rages from 20 to 55 m2 living space per person in Europe (Figure 1). The European average has increased by 16% from 2000 to 2018 driven by changes in comfort levels as well as in occupancy levels as the number of single-person households is increasing along with aging population and changes in family structures. The indicator alone does not give “a good or bad score” in energy sufficiency, as it should be related to heating and cooling needs. If both are minimal for climatic reasons, the need for moderation in the use of space is more related to carbon reduction from the use of materials and land.
An example calculation is made here on the energy saving potential from a lower housing space per person. Let’s assume that floor area per person would be maximum 35 m2 all over Europe, which is a bit lower than the current European average. Applying this to countries where the level is higher, savings in space would theoretically be 2.9 billion m2 at the European level. Using specific consumption of energy for space heating (kWh/m2) in each of these countries (data missing for Norway), energy savings could add up to 322 TWh/a, which is 16% of heat consumption of EU-28 households in 2018.
Figure 1: Floor area per person in 2018

Source: Odyssee Database
Energy Sufficiency Indicators for Transport in the Odyssee Database
The Odyssee database provides data on cars per person, road and air travel mileage per person, load factor of cars, as well as data on modal split and car features.
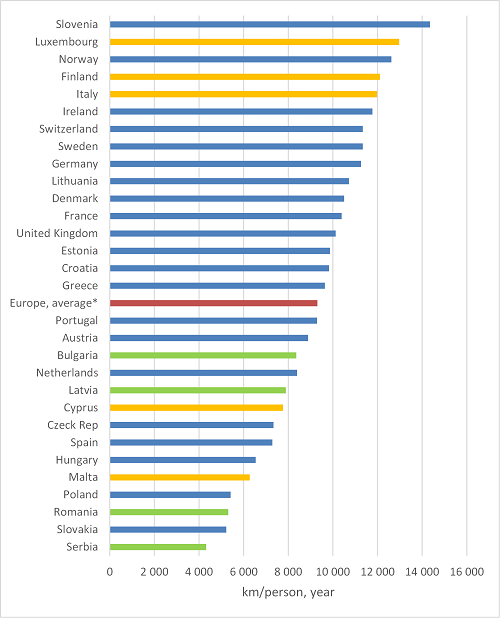
Figure 2 reveals large differences in person-km travelled using cars in Europe. In addition to behavioural factors, there are structural factors affecting the differences such as urban structures and public transport service levels, as well as car and fuel taxation policies. The figure also indicates which countries have the lowest and highest car ownership ratios per person.
Figure 2: Car travel mileage per person in 2018

* European average calculated as the arithmetic average of individual countries presented in the figure.
Source: Odyssee Database
An example calculation in car transport is made here for countries with average mileages per person exceeding the European average. If these would be at the European average level, total car mileage would be reduced by 562 billion km. This corresponds to energy savings of about 374 TWh (18% of the total consumption for car transport). The actual possibilities for reduction of mileage depend on the circumstances and this example calculation should not be viewed as a calculation of the actual energy saving potential.
Energy Sufficiency Indicators for the Services Sector in the Odyssee Database
The mix of sufficiency indicators for the services sector is more limited than in household and transport sectors and adequate data is not available for all countries to use the most meaningful indicators. The Odyssee database enables monitoring the floor area per employee, and the final energy consumption and electricity consumption per floor area or per employee.
Relating energy consumption with the number of employees has quite little information value as consumption rather dependent on the customer and sales volumes, and employees are increasingly replaced by ICT technologies, again, adding to the consumption.
Floor area per employee in offices is one of the metrics best applicable around Europe as office work as such is quite similar everywhere. Unfortunately, data on the floor are of public and private offices is available in less than half of the countries. Among them, there is a range from 18 m2/employee in Spain to 88 m2/employee in Denmark and 103 m2/employee in the UK. The higher end is so high that it raises some questions on data quality.
Policies and Measures in the MURE Database
Quite many of energy efficiency policies and measures, as collected in the MURE Database, also address energy sufficiency, but not all of them. On the other hand, energy sufficiency can be promoted by policies other than those primarily established for energy efficiency reasons.
Sufficiency policy types in residential and service sector buildings include:
- Building codes: caps on space, flexible use of space and facilities, and automation/control of heating and cooling
- Taxation: property taxation
- Public housing: rent bonus to tenants for changing to a smaller flat
- Shared economy: co-living, rental of facilities instead of ownership
- Public sector: programmes aiming at efficient use of space (real estate management) (example)
- Information measures addressing procurement and habitual behaviour building energy certificates
In the transport sector, policies and measures can be used to modify distance travelled, mode choices, vehicle choices, driving styles and passenger load factors. These include:
- Taxation: fuel taxation, taxation of new cars (example), annual car taxation, and taxation of shared cars
- Pricing policies: road tolls, congestion fees, price of public transport, parking pricing, and internalization of transport externalities
- Subsidies: electric bikes (example of early action)
- Infrastructure: bus lanes, cycling lanes, moderation of parking, and good winter-time maintenance of walking and cycling infrastructures
- Urban planning: land use, urban density requirements (example) and car free zones
- Building codes: requirements for bicycle storage, e-bike charging, and parking/charging for shared car services
- Shared and/or smart mobility services (example, mobility management (example1, example)
- Promotion of teleworking
- Digitalization of services
- Information measures addressing procurement and habitual behaviour, such as vehicle labelling
Eco-design is a tool to moderate energy consumption by appliances. For example, new automatic and smart control functionalities can be developed (Toulouse & Attali 2018)3. Personal carbon budgets are an example of a potentially effective but technically, socially and politically challenging measure.
The MURE database allows identifying some energy efficiency measures also as energy sufficiency measures. This is a new feature introduced into the database only in the spring of 2021. Although sufficiency data is not fully complete yet, some observations on the incoming data can be made.
The UK Boiler Plus standards set requirements for individual boiler time and temperature controls. Finland has completed a programme for reducing office space per employee in public administration.
Transport measures mentioned are larger mobility management programmes (e.g. Germany and France), taxation of vehicles and fuel (e.g., Denmark and Finland), labelling of vehicles (e.g., EU and Switzerland), and modal shift to public transport (e.g., Latvia and Finland). Portugal mentions a sustainable mobility programme for the public sector.
The New Energy Programme in Poland aims to add innovation at the systemic level facilitating, e.g., plus-energy buildings, smart cities and self-sufficient energy clusters, thus providing a platform for a more energy sufficiency and energy efficiency -oriented future.
Policy Implications
Energy sufficiency is strongly connected not only to energy efficiency but also to other sustainability topics like sustainable consumption or circular economy. It has the potential of strongly contributing to keeping the burden caused by humans under the maximum carrying capacity of the environment. Yet, this potential is still underused in policy and somewhat marginalized.
Although any pressuring of people to change their lifestyles may be politically challenging, some willingness for change has been observed, e.g., in a recent survey in France in Ademe’s barometer for policy acceptance and behavioural change. It discovered high level of willingness to change habits related to heating and lighting as well as procurement of goods and food, but low willingness for modal shift in transport. There is also an ongoing shift from ownership of goods, vehicles, and space to procurement of services and usage of digital and shared services, as the platform economy is growing around Europe.
The necessary policy tools such as building codes, taxation and urban planning are already at hand. At the strategic level countries have their policy programmes and roadmaps aiming to low carbon future. The logical next step would be to nationally investigate the benefits of energy sufficiency and plan measures which could be included into these programmes and roadmaps, and to choose key indicators for monitoring progress. This would require both a good information base both on the potential energy savings and emission reductions, and a lot of courage to publicly discuss such changes in lifestyles.
Notes
- 1: Darby S. & Fawcett T. (2018): Energy Sufficiency: A Concept Paper for eceee. Eceee’s Energy Sufficiency Project.
- 2: Burke, M.J. (2020): Energy-Sufficiency for a Just Transition: A Systematic Review. University of Vermont. Energies Journal 13 May 2020.
- 3: Toulouse E. & Attali S. (2018): Energy Sufficiency in Products. A Concept Paper for eceee. Eceee’s Energy Sufficiency Project.


