Summary
Key questions
- What has been the overall trend in the final energy consumption of buildings in the EU since 2010?
- What are the main drivers of the energy demand of buildings in the EU?
Lead authors: Marie Rousselot and Frédéric Pinto Da Rocha (Enerdata)
Reviewers: Bruno Lapillonne (Enerdata)
In most European countries, buildings account for the largest share of final consumption.
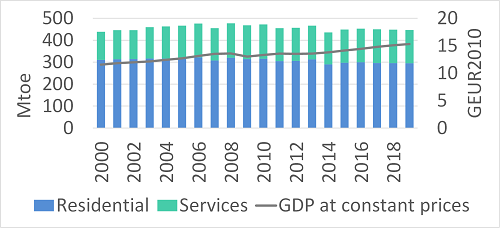
At EU level, buildings account for 43% of the final consumption. Their consumption has been stable since 2014 while GDP has increased by 1.5%/year (2014-2019). This follows a decline in consumption after the financial crisis (- 1.5 %/year in 2008-2014). At EU level, two-thirds of the building consumption is for residential buildings (Figure 1): the share of services increased from 29% in 2000 to 33% in 2008 and has been rather stable since then.
Figure 1: Total consumption of buildings and GDP
Source: Odyssee
Energy consumption trends
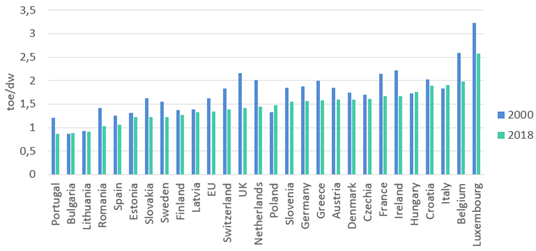
The average energy consumption in the EU is 1.3 toe/dwelling in 2018. There are large disparities between countries, even after adjustment to the same climate, ranging from 0.9 toe/dwelling in Portugal to 2.5 toe/dwelling in Luxembourg. This unit consumption has been decreasing in most countries since 2000 (- 1.1%/year at EU level), except in Bulgaria, Poland, Hungary, and Italy (Figure 2).
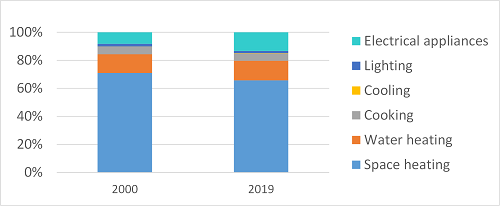
Between 2000-2019, downward trends are observed for space heating, the dominant end-use with 66% of the household consumption, and cooking (only 5% of the total) (consumption decreases by -0,5/%year and -0.3%/year for space heating and cooking respectively). Over the same period, increasing trends are observed for household appliances (2.5%/year) and water heating (0.2%/year increase in consumption).
Figure 2: Energy consumption per dwelling, scaled to the EU average climate
Source: Odyssee
In 2019, appliances have almost overtaken water heating and now account for 13% of household consumption, against 14% for water heating (Figure 3).
Figure 3: Household energy consumption by end-use in the EU
Source: Odyssee
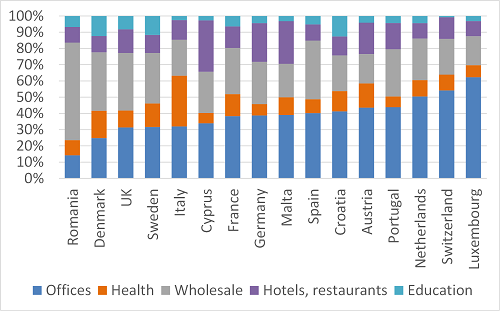
Electricity accounts for almost half of the total energy consumption of services. Offices and trade wholesale and retail) consume around 2/3 of electricity in services1 at EU level.
Figure 4: Total electricity consumption of services by branch (2018)
Source: Odyssee
Energy efficiency trends
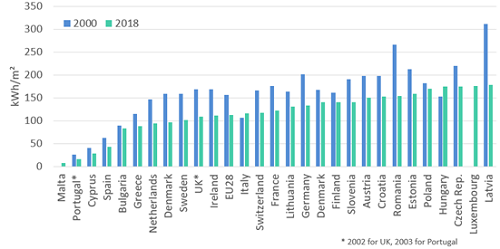
The specific consumption of households for heating has decreased in almost all countries since 2000 (- 1.8%/year on average in the EU). The reduction was above 3%/year in Latvia and Romania and between 2 and 3%/year in 7 other countries (France, Germany, Ireland, Netherlands, Portugal, Spain, and Sweden) (Figure 5).
Figure 5: Household heating consumption per m2 (climate corrected)2
Source: Odyssee
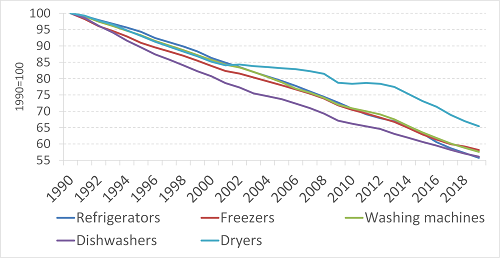
The specific consumption of large appliances (measured in kWh per appliance) has decreased steadily since 1990 thanks to labelling and eco-design regulations (Figure 6).
Figure 6: Specific energy consumption of large appliances
Source: Odyssee
Efficiency gains are above 40% (i.e., around 3%/year) for cooling appliances (refrigerators and freezers), washing machines and dish washers; for tumble dryers, gains are slightly lower, around 35% (Figure 6).
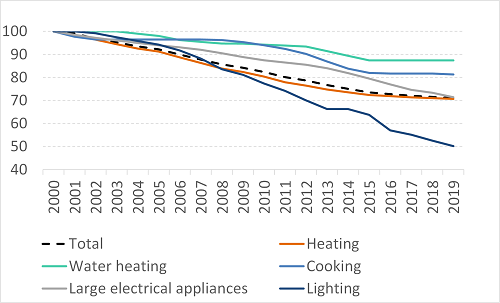
Household energy efficiency has improved by 29% at EU level between 2000 and 2019 (or 1.8%/year) as shown by the energy efficiency index, called ODEX (equal to 71 in 2019, Figure 7)3 .
Figure 7: Trends in household energy efficiency at EU level, according to ODEX
Source: Odyssee
However, a significant slowdown has been observed since 2014: the reduction in ODEX has been twice lower, mainly because limited efficiency gains in space heating efficiency (the largest end-use), and, to a lower extent, water heating and cooking. The downward trends of energy efficiency observed for these end-uses were not offset by the larger efficiency gains for large appliances and lighting (Figure 7).
Variations of buildings consumption
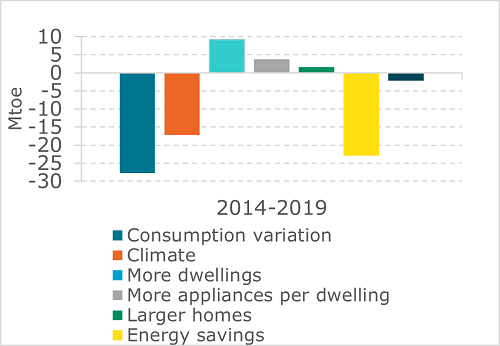
Between 2014 and 2019, the household consumption has decreased by 28 Mtoe. Increases in housing stock and more consuming lifestyles have contributed to an increase in consumption of 15 Mtoe. Energy savings have more than offset this increase by reducing consumption by 23 Mtoe. The warmer climate in 2019 further reduced consumption by 17 Mtoe (Figure 8).
Figure 8: Drivers of household energy consumption at EU level
Source: Odyssee
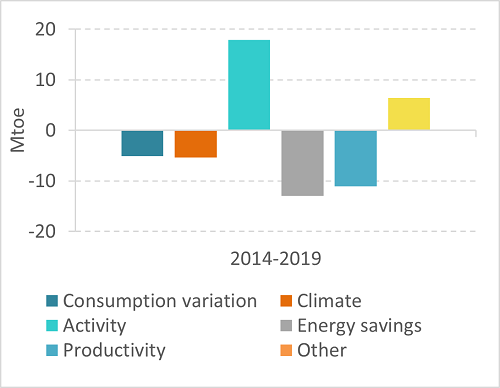
For services, the activity contributed to increase consumption by 18 Mtoe. Energy savings and productivity gains offset this increase by reducing consumption by 24 Mtoe (Figure 9).
Figure 9: Drivers of energy consumption in services at EU level
Source: Odyssee
Notes
- 1: Services include private and public buildings (offices, shops, schools, hospitals) as well as public lighting.
- 2: 2002 for UK, 2003 for Portugal; no data available before 2008 for Luxembourg and before 2016 for Malta. No data on m2 for Belgium.
- 3: https://www.odyssee-mure.eu/publications/other/odex-indicators-database-definition.pdf
